New viztypes for ShowMeMore
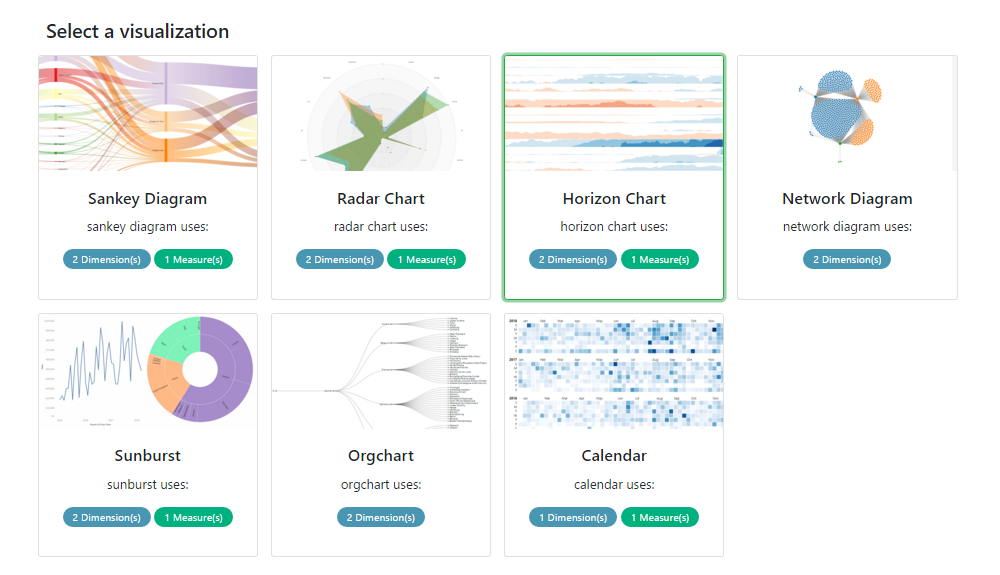
We just released two exciting new features of the Premium and worldwide most downloaded Extension for Tableau: Show me More! First of all, we added a new visualization type: the Horizon Chart. Besides that, we enable our ShowMeMore Tableau Extension users to configure the background color of Visualizations like Sankey Diagram, Radar Chart, Sunburst and Horizon Chart.
These new features are both available in our create, share and enterprise subscription plans. Try this magnificent ShowMeMore extension for free and get to know the ease of use!

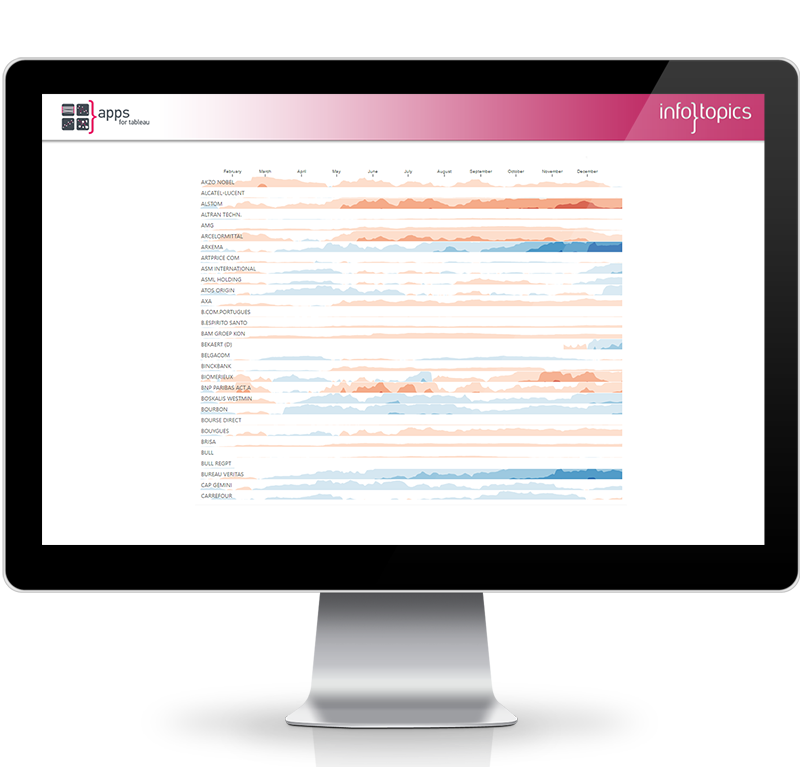
Horizon Chart
The Horizon Chart is a brand new visualization type (viz) we added to the Show me More extension for Tableau. A Horizon Chart shows metric behavior over time in relation to a baseline or horizon. You can track metric changes above and below a horizon for several data series in one chart.
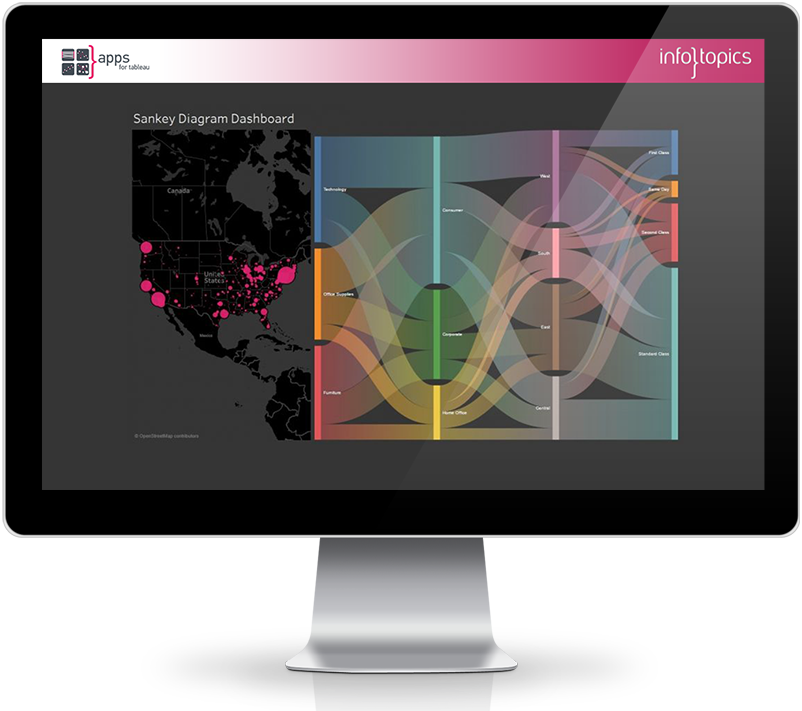
Custom Backgrounds
One of the features requested is the ability to apply a custom background to the Show me More visualizations. Being able to to set the backgroundcolor of your Show me More vizzes, helps integrating them even better in your dashboards!

We love to make solutions and help Tableau users to do things more efficiently. If you have feedback, ideas, questions or need support, please make sure to share it with us! Also, don’t forget to follow us on social media for our latest news and updates.
