Tableau Extensions in Education: How They Are Transforming the Industry

Every decision made within an educational organisation has a profound impact on students’ learning experiences and the institution’s success. Now, picture having an integrated dashboard that offers real-time insights into student performance, resource allocation, and institutional efficiency. In the dynamic world of education, success is not just about making decisions; it’s about making the right decisions that shape the future of education. Welcome to a deep dive into our Education Industry Tableau Dashboards, equipped with cutting-edge Tableau extensions, and discover how they are transforming education through data-driven excellence.
An in-depth use case exploration
Personalised Student Support
For educators, one of the challenges is to identifying students who may be struggling and providing timely support.
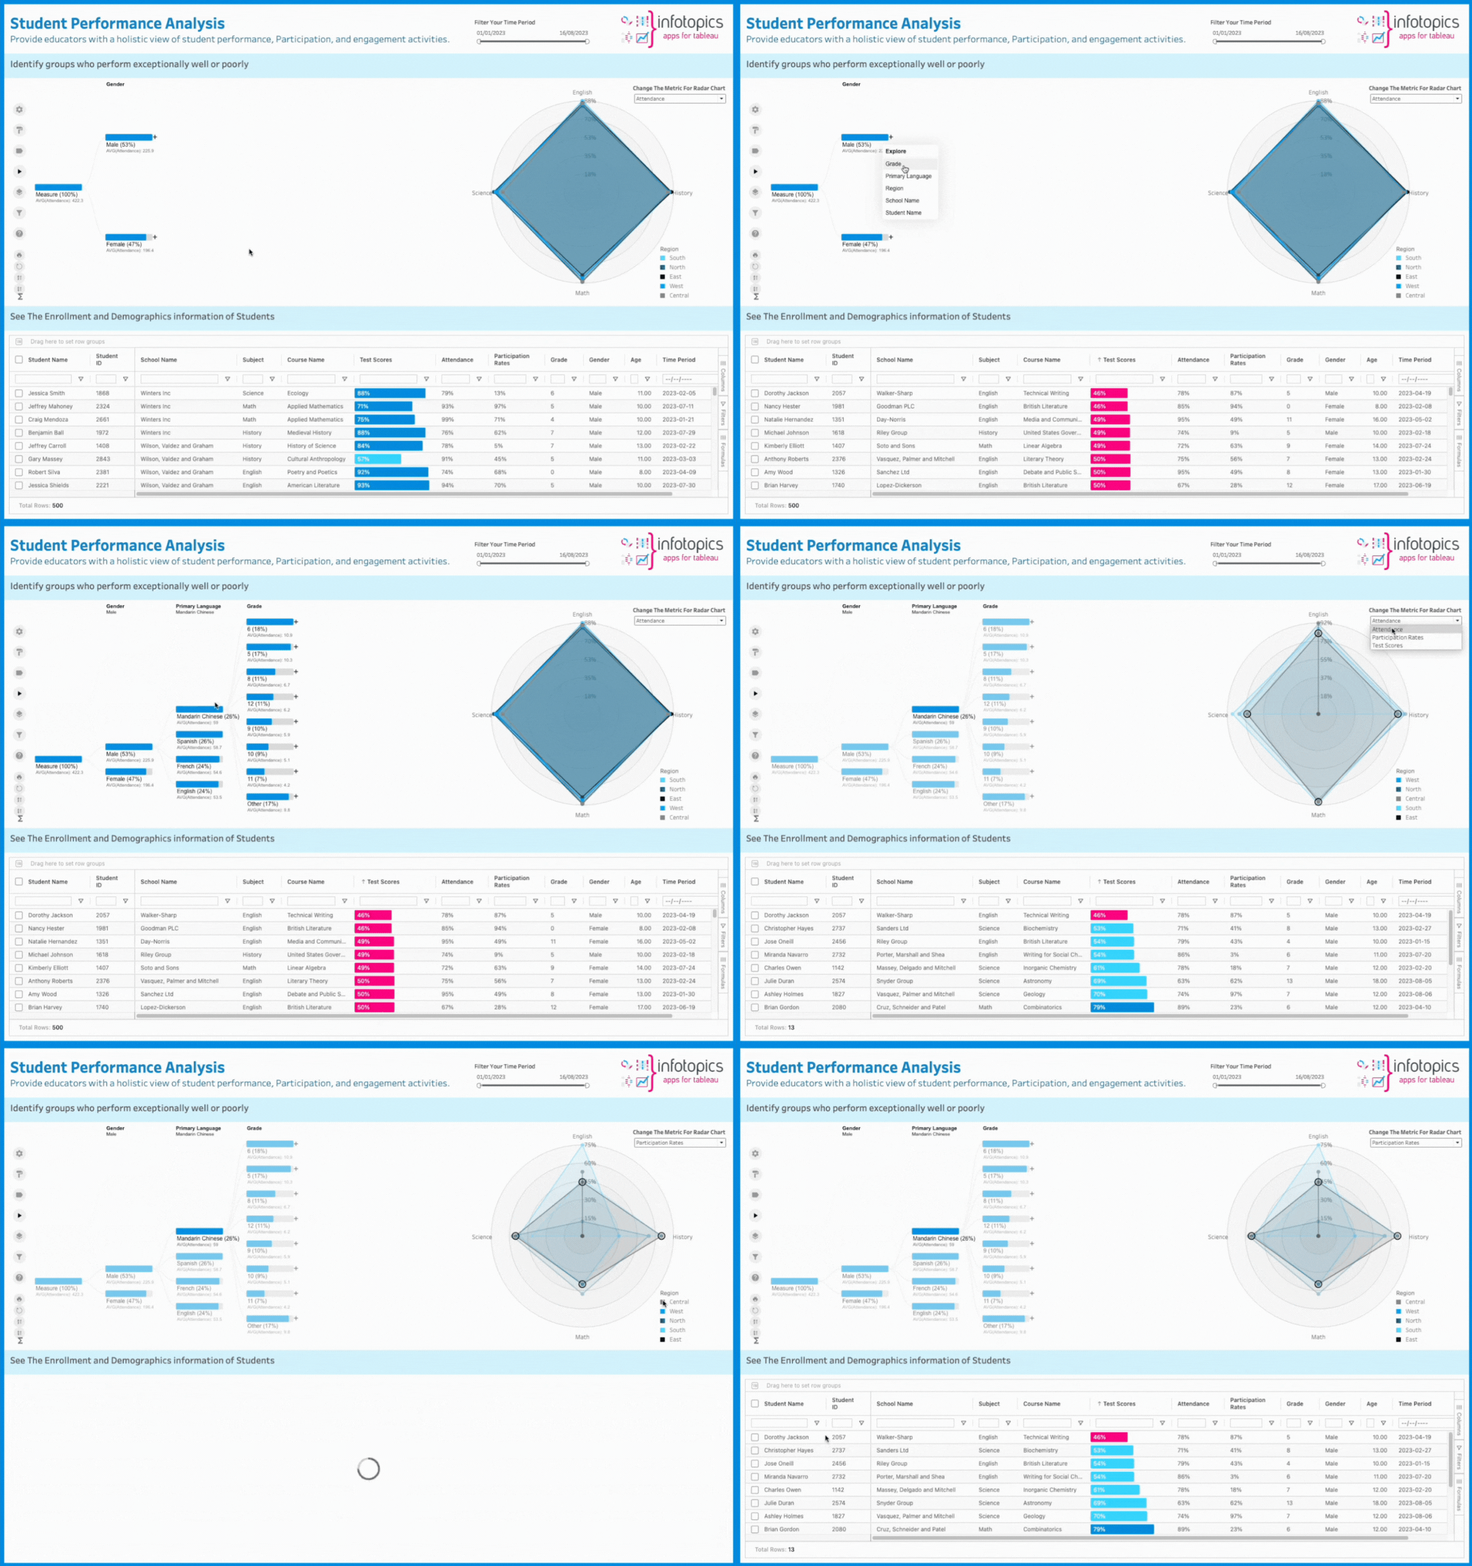
Our solution, the Student Performance Analysis dashboard, empowers educators to dive deep into student data. It offers the ability to segment students by key dimensions such as gender, primary language, grade, region, and school name with DrillDownTree. This efficient approach allows for quick identification of at-risk students. With the added benefits of dynamic radar charts and SuperTables extensions, educators gain comprehensive insights, enabling the implementation of tailored support programs.
Curriculum Enhancement
Another ongoing challenge is to continuously enhance the curriculum to meet evolving educational standards.
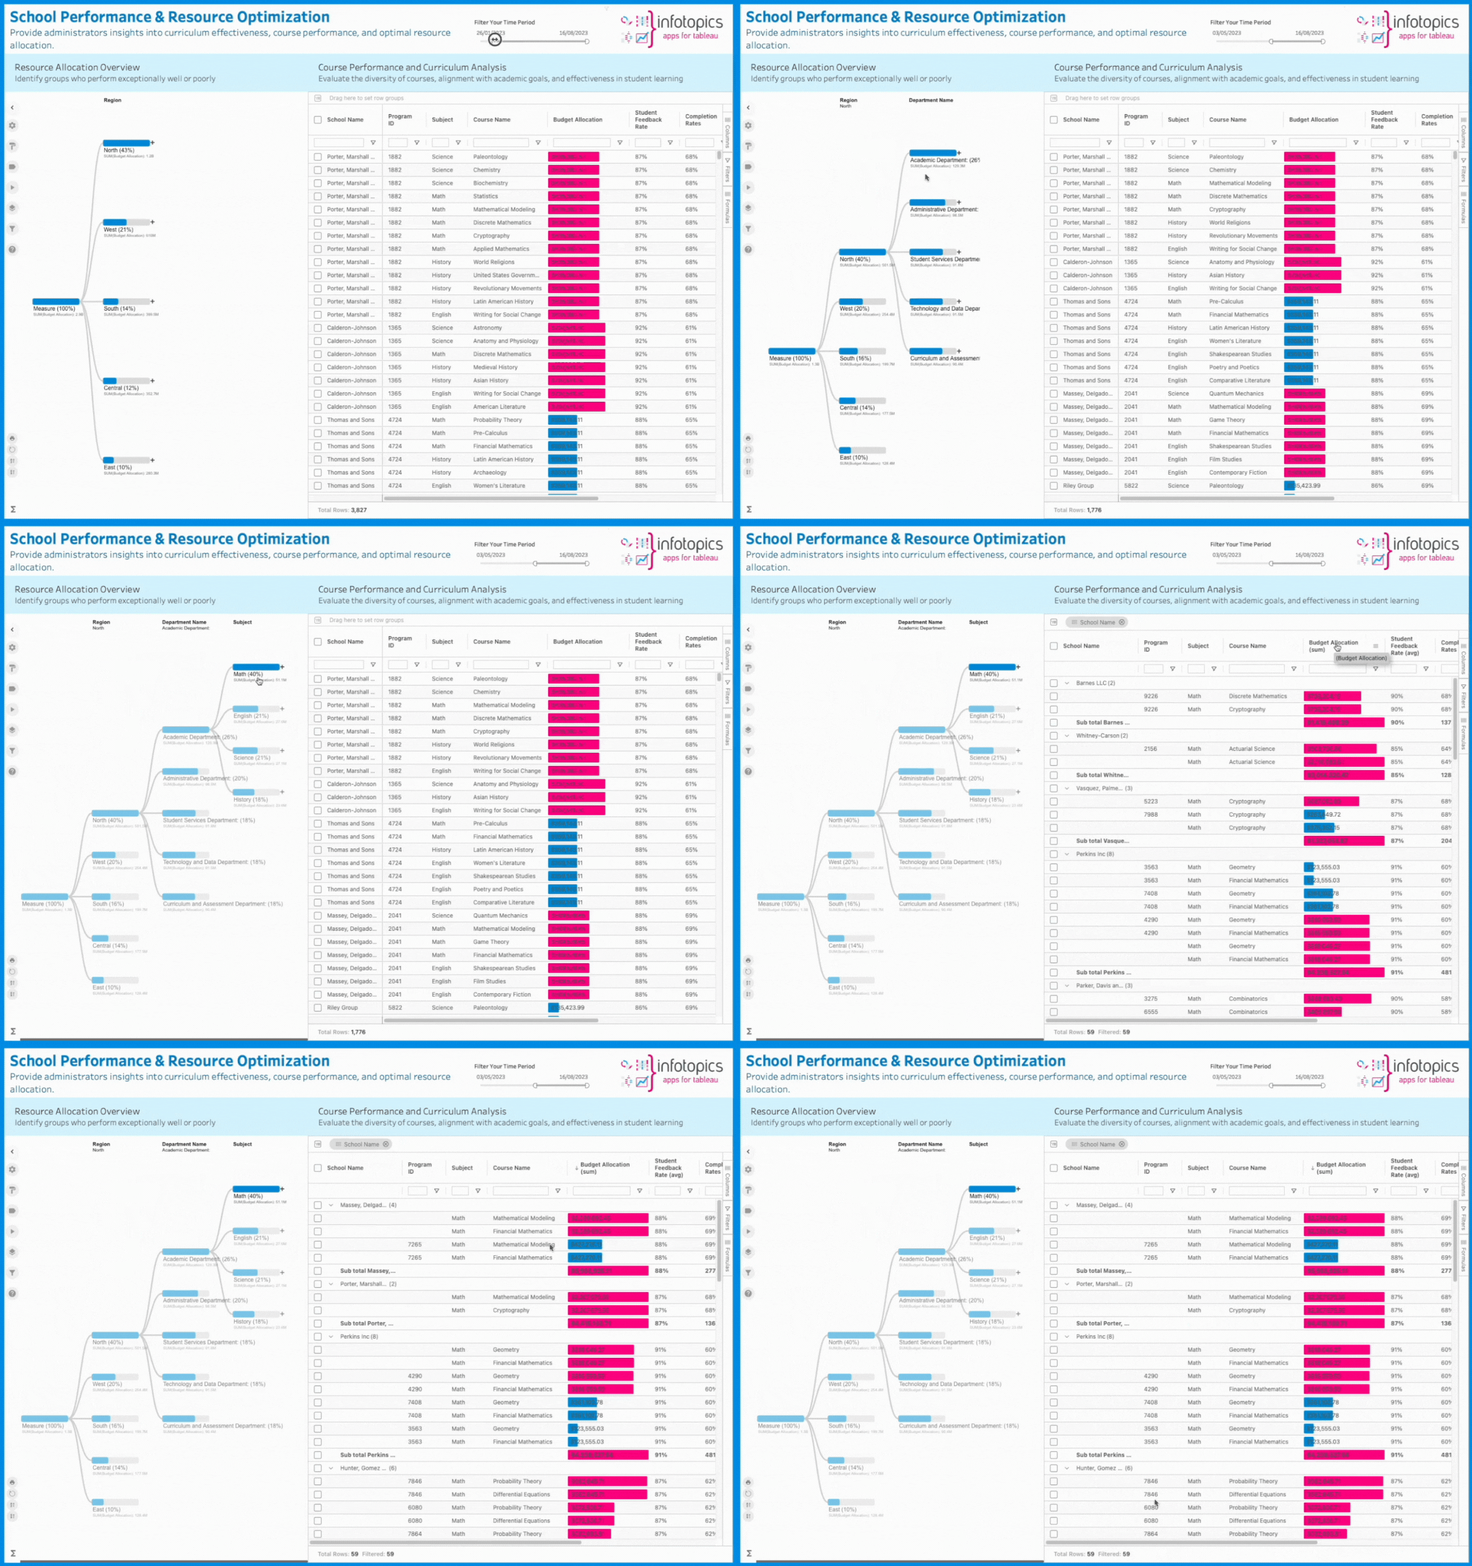
The School Performance Evaluation dashboard, offers a comprehensive view of the curriculum design process. Leveraging Tableau extensions in education, institutions can analyse curriculum effectiveness, pinpoint areas for enhancement, and swiftly adapt to changing requirements. With customisable visuals available through SuperTables, this process becomes even more streamlined and efficient.
Resource Allocation Efficiency
One of the challenges in educational management is to efficiently allocate resources, which includes budgeting and staffing decisions. Our School Performance Evaluation dashboard, equipped with Tableau extensions, provides a clear path to tackle this challenge. It empowers educational institutions to delve into budget allocation, staffing levels, and enrolment data. Using dynamic charts with DrillDownTree and customisable tables in SuperTables, administrators gain the power to make informed decisions regarding the distribution of resources. This simplicity of data analysis supports a more effective resource allocation strategy.

Institutional Efficiency
When it comes to school administration, the challenge is to make things run smoother and more efficiently. Our dashboards are designed to do just that by cutting down the time spent on data tasks. With the help of Tableau extensions in education industry, like SuperTables, ShowMeMore and DrillDownTree in these dashboards, data becomes clearer, allowing administrators to focus on making strategic decisions that improve the school’s performance.
Start your Journey
Ready to unlock the full potential of your educational institution? Begin today with Apps for Tableau Extensions and experience the era of data-driven excellence in education.