Using Viz Extensions to Visualize Educational Funding & Performance
The Educational Funding and Performance Dashboard provides a visual overview of funding distribution, grant types, cost management, and financial performance across some higher educational institutions. It highlights the breakdown of funding sources, types of grants, and the geographic distribution of colleges and students. Key financial metrics such as cost growth, revenue growth, and budget utilization are tracked to help stakeholders make informed decisions about resource allocation and performance optimization.
Using PowerKPIs to aid financial tracking
PowerKPI’s makes creating KPI cards in Tableau very easy and efficient. In this dashboard PowerKPI’s have been used to track financial metrics related to educational institutions such as administration and facilities costs.
Using Viz Extensions, the cards can be created in a sheet and then dragged out to the dashboard:
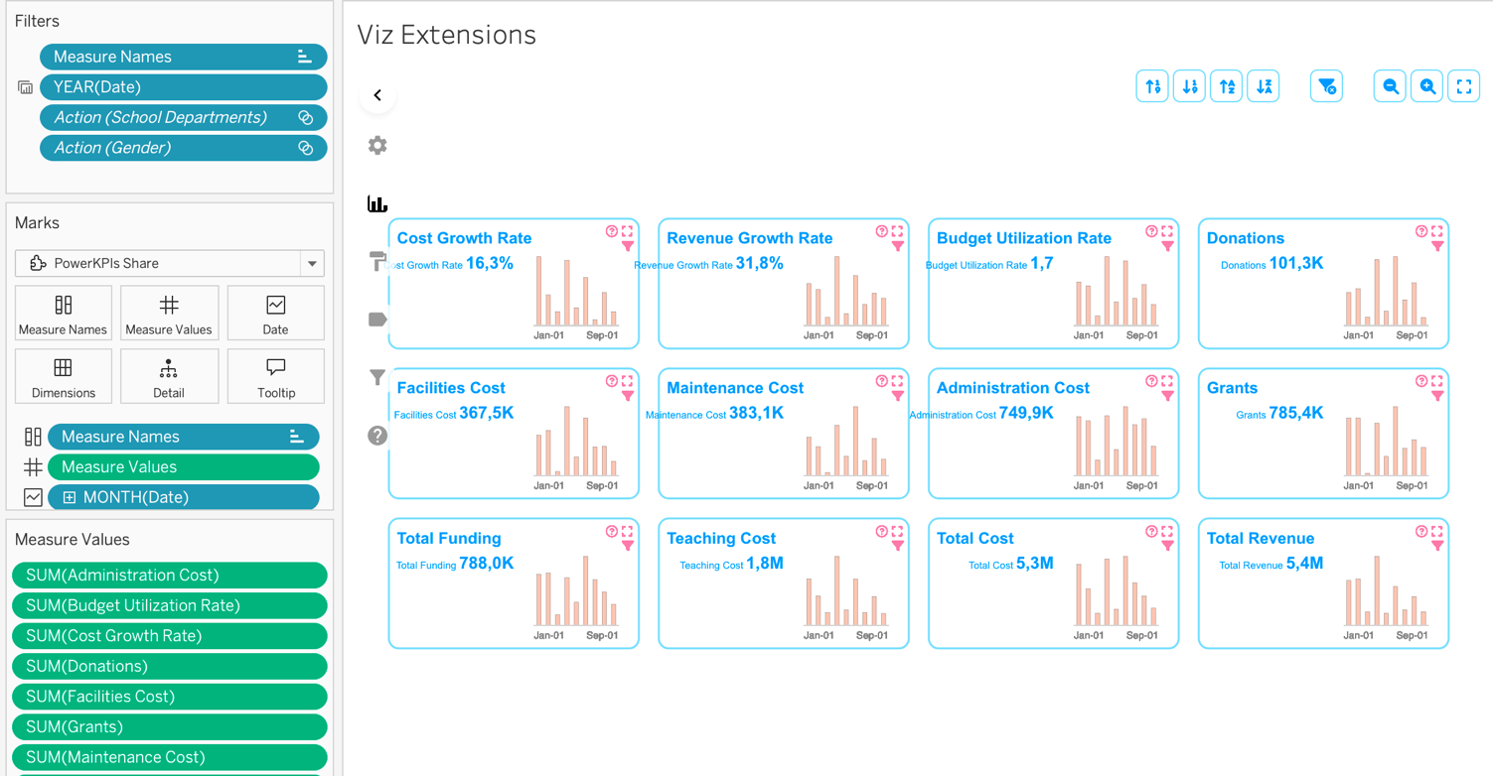
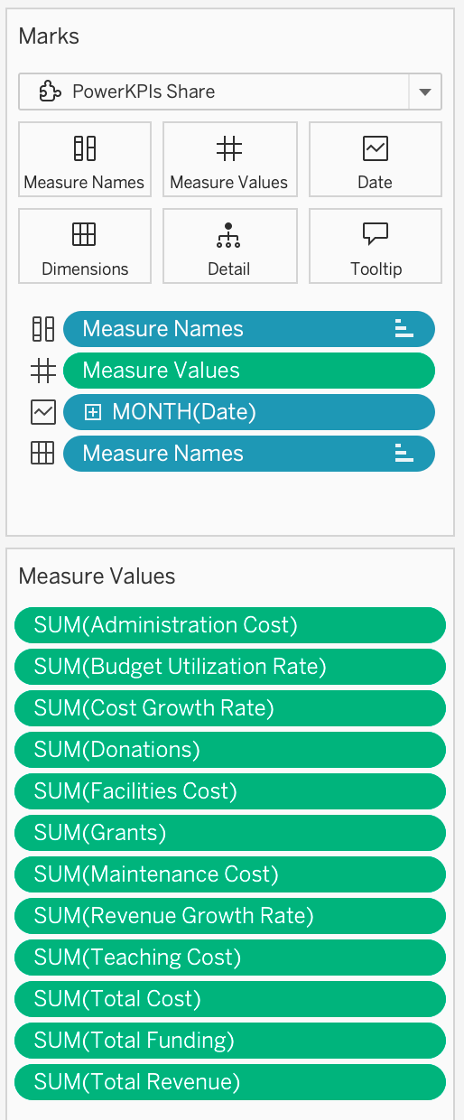
After selecting the Extension from the marks card, you can simply drag the fields to the corresponding tiles. In this case measure names has been placed on the filters card as not every measure has been used.
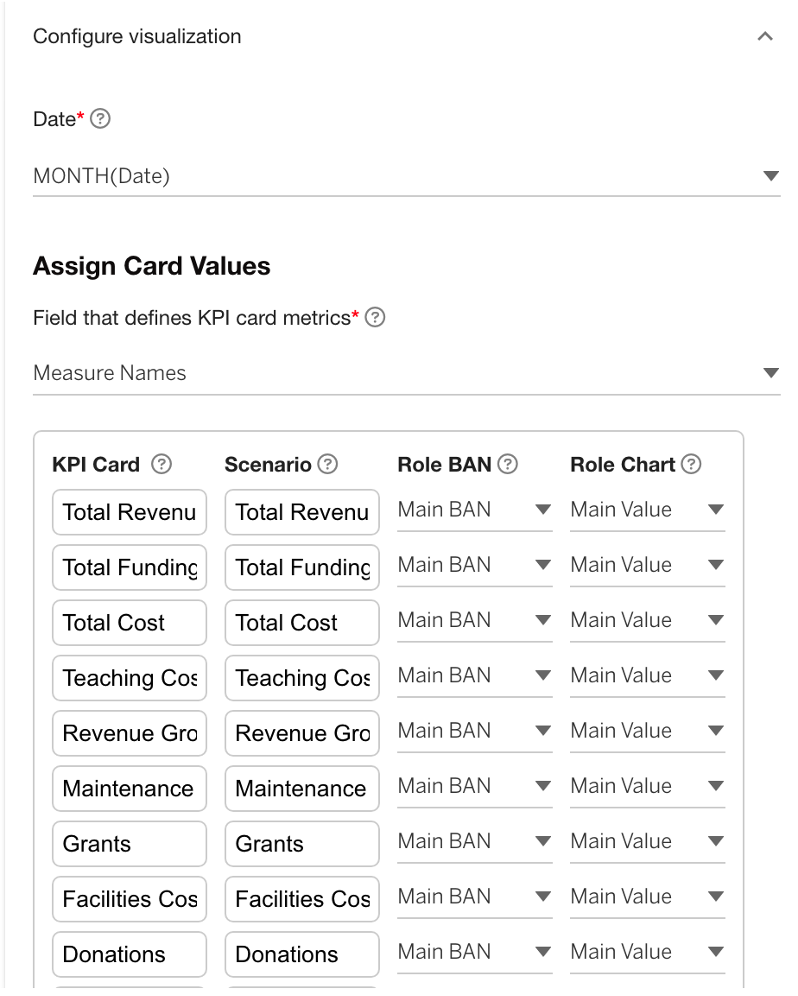
The configuration steps involve the following:
– Select a grid layout
– Select the data structure
In this case, A KPI card per measure has been selected where scenarios are dimension members.
– Configure field roles
In this case, the PowerKPI’s show the values on a monthly basis and the main number will show the most recent monthly value.
Since there are no comparisons, the set up is very simple and automatically configured:
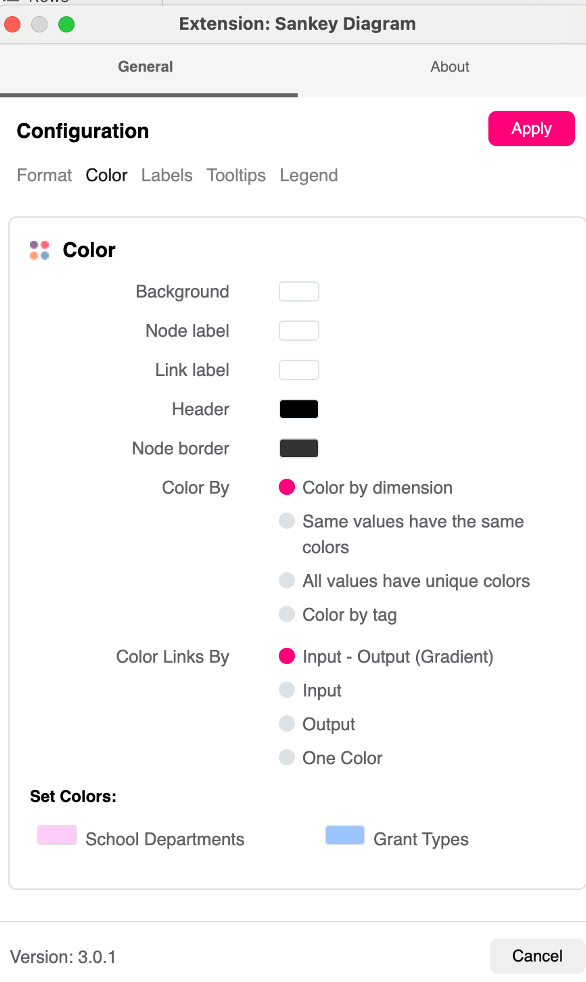
The Sankey Chart is from the ShowMeMore range and has also been added using Viz Extensions. This chart is best at segmenting and visualizing proportions between the grant types and departments.
To create the Sankey Chart, simply select the option from the marks card dropdown, and drag the fields to the correct tiles:
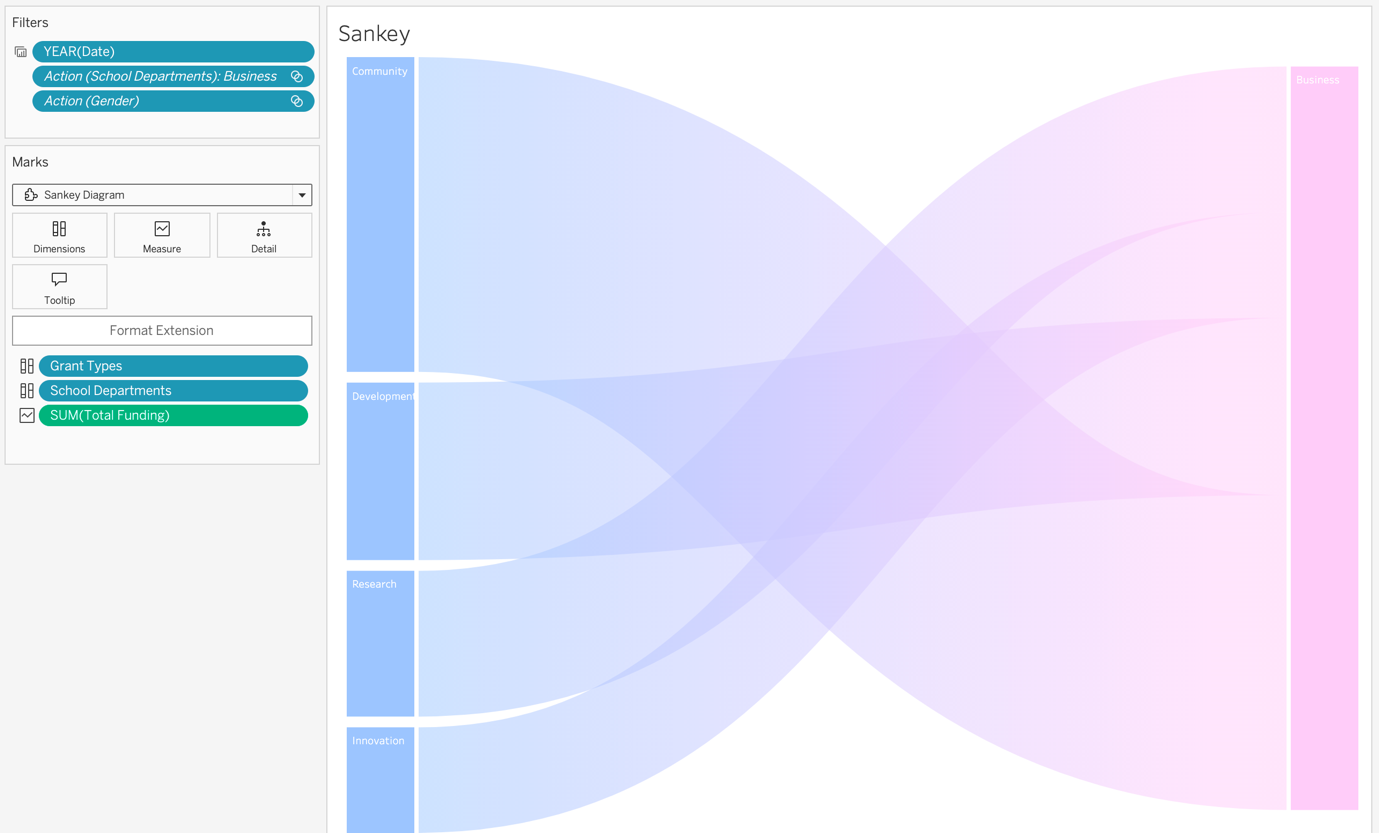
To create the gradient effect, select format Extension and select:
The PowerKPIs and ShowMeMore Extensions have added great value to the Educational Funding & Performance dashboard and has been very easy to configure and enjoyable to create.
We look forward to creating more use cases and sharing them with you.

