Tableau Next-Level.
Hands-on workshop featuring guest speaker Andy Cotgreave.
February 5th, 4-5:30 PM GMT
25 Watling St, London
This workshop in Tableau covers:
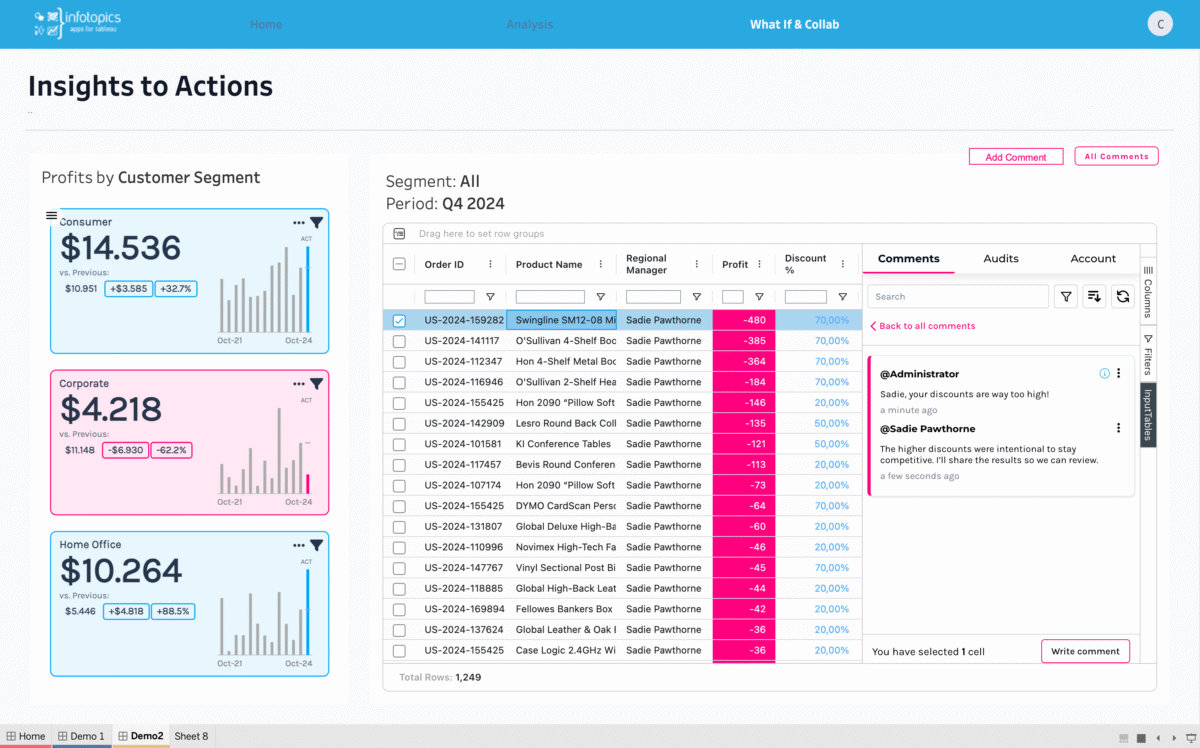
- Interactive Excel-like pivot Tables, Metric Trees, and visualizations like Waterfall, Radar and Sankey charts.
- Writeback capabilities for forecasting, what-if analysis and collaboration.
- Book signing by Andy Cotgreave.
- Networking with the community over drinks and bites.
- Be the first to see Viz Extensions in action in Tableau Next!

*Limited seats are available. Sign up without delay using your business email to secure your seat.
What’s required.
Bring your own laptop with Tableau Desktop 2024.2 or higher installed.
Receive a free copy of Dashboards That Deliver, featuring the Metric Tree chapter, personally signed by Andy Cotgreave.

Meet your hosts.

ANDY COTGREAVE
Speaker and Author
How To Speak Data

VINCENT CRUCKSHANK
UK Country Manager
Infotopics | Apps for Tableau

DEREK MUZIRA
Customer Success Manager
Infotopics | Apps for Tableau

GRAEME KEMP-JONES
UK Head of Sales
The Information Lab
If you have any questions, please contact us at [email protected]
Tableau Next.
Premium Extensions for Tableau Next are in development! This vision aims to support a smooth transition to Tableau Next, strengthen adoption across teams and help organizations connect more deeply with the Salesforce ecosystem. During this workshop, you will be taught how to supercharge your dashboards in Tableau Core and be one of the first to experience an exclusive sneak preview of how your favorite Tableau Extensions, including SuperTables, now effortlessly enhance Tableau Next.
Premium Tableau Extensions.
ShowMeMore
Create beautiful new visuals in Tableau with just a few clicks.
Want to quickly embed an interactive Sankey diagram to visualize flows? In urgent need for a flexible Radar Chart in your HR dashboards? Visualize a dynamic Network Graph to illustrate your department structure? We’ve got you covered.
SuperTables
Interactive Excel-like Tables.
Empower your Tableau Viewers with interactive, dynamic Excel-like pivot tables that can be highly configured to meet your use cases. Enable self-service analysis for everybody easily and familiarly without leaving Tableau.
PowerKPIs:
Your starting point for Tableau analysis.
Understand your business performance at a glance. Use custom KPI cards to visualize key metrics with the Value Driver Tree and gain a deeper understanding of your performance, and explore cause and effect.