
Bridging the gap between creative and analytical using SuperTables and PictureThis.
The Challenge
Savage X Fenty needed a centralized, efficient, and user-friendly reporting solution. Their previous SAAS tool lacked flexibility, forcing analysts and stakeholders to rely on manual processes and external spreadsheets. Filter setup was tedious, dashboards were slow to load, and adding product images for reporting was a time-consuming task. With a fast-paced business and highly analytical users, the brand needed tools that could support true self-service and streamline both backend setup and front-end usability, without compromising visual storytelling.
The answer came with SuperTables and PictureThis, extensions that brought efficiency, self-service, and visual storytelling directly into Tableau.
SuperTables: Easy Setup & Self-service
SuperTables is one of the premium Tableau extensions that Savage X Fenty brought into its dashboards. Before Tableau, Savage X Fenty was using another SAAS tool for reporting, which would not satisfy their needs and would often pose challenges in daily operations. The company wanted to bring all stakeholders into one central place for their reporting needs. This is where Tableau and extensions came into play!
Before Using SuperTables
Savage X Fenty is a highly data-driven company with very analytical stakeholders. These stakeholders needed to have the ability to manipulate the data in Tableau and drive their own insights with self-service. Previously, they would use a spreadsheet to fulfill these needs. However, moving to a central reporting platform required solutions within Tableau.
Initially, adding filters to the data was time-consuming, as it had to be done manually, and each filter had to be added one by one. From then, when the viewers wanted to use the dashboard, it would take a long time to load. The entire setup process and the use of the filters were inconvenient for the company.
Results Achieved
In terms of applying filters on the back end, SuperTables saves analysts at least 30 minutes to set the filters in the dashboard. On the front end, it speeds up the loading process of a dashboard with applied filters by 30 seconds. Considering this time for multiple filters on hundreds of dashboards, it adds up to a lot of saved time for the users.

“Since SuperTables is so user-friendly, we find that our stakeholders intuitively know how to navigate the tool & feel empowered to conduct their own analysis. We’ve had great success introducing teams who power-use spreadsheets to Tableau by bridging the gap with SuperTables”
About Savage X Fenty
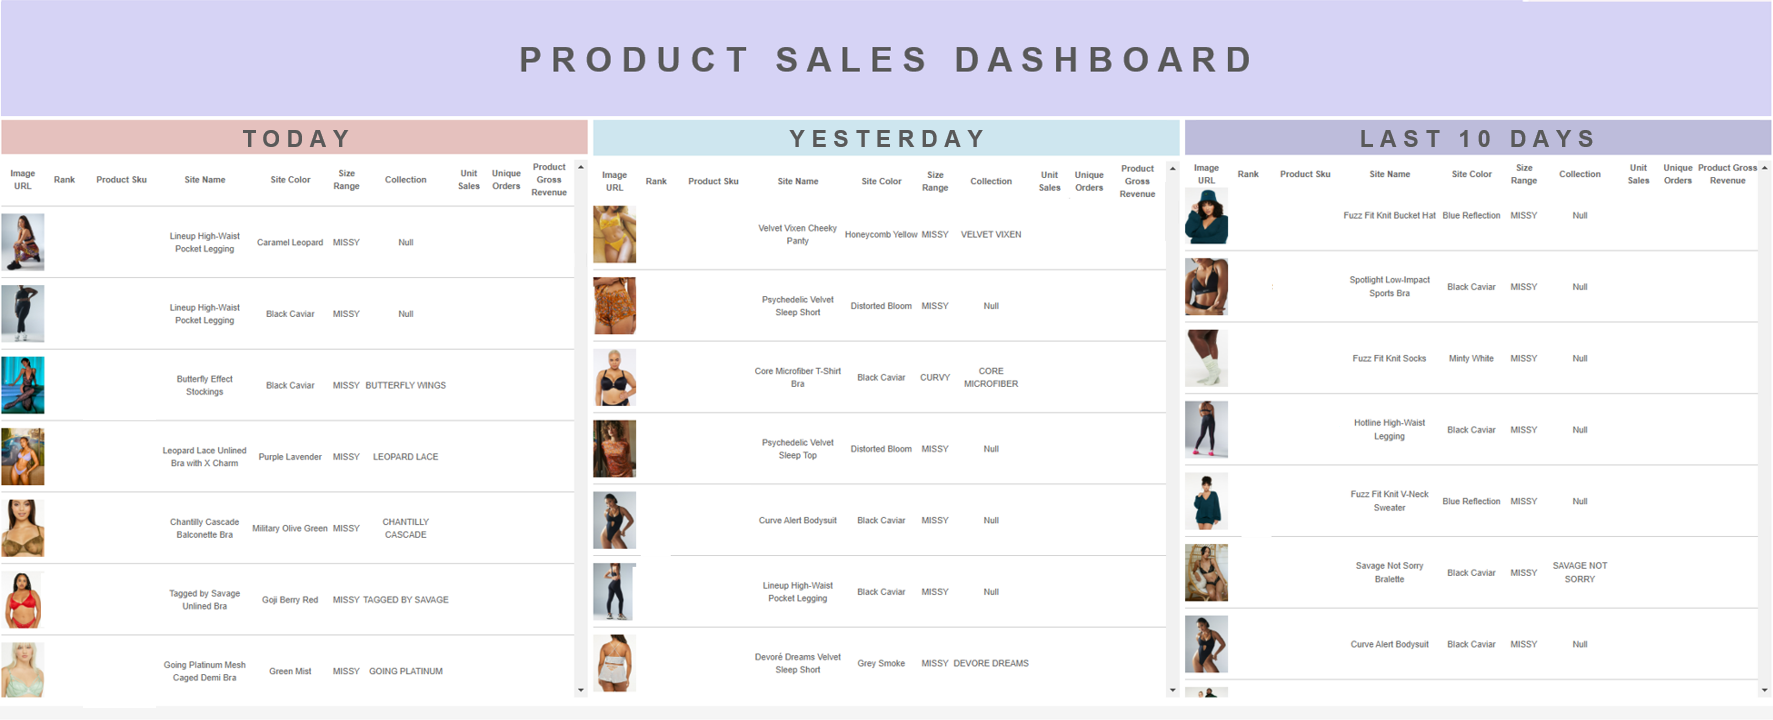
PictureThis is an essential solution for every retail company, such as Savage X Fenty. Being a creative fashion enterprise, the brand has a wide assortment of product categories and offerings. Having high-quality product imagery when analyzing the data is vital, as it is extremely helpful for communication and aligning on what is being reviewed.
In the past, the data team used a macro file containing all the codes of the product imagery. When hitting enter, this file would pull all the necessary images one by one, which would take a long time. Afterwards, the team would have to manually create a story with these images and the data and transform it into a report.
Use Case
Nowadays, all of this is possible with just a few clicks on PictureThis. Adding product pictures alongside the data is extremely easy and automatically aligns the image to the data elements, contributing to a nice data story. These dashboards are used a lot in weekly meetings and are easy to export as a PDF or Excel file.In addition, Savage X Fenty has another value-added use case with PictureThis. The company uses algorithms on their website to ensure an optimal user experience. With PictureThis, they can test different algorithms and see what the website would look like before actually placing the products. PictureThis not only unlocked reporting capabilities but also the ability to create stronger website algorithms.
Results Achieved
Similar to SuperTables, PictureThis saves at least 30 minutes of dashboard development time and reduces the manual workload. Furthermore, the value of being able to see the product images alongside the data is unquantifiable for the brand.

“Our creative stakeholders feel much more empowered when they see the products in the photos. PictureThis helps bring our data to life in a very unique and efficient way. It is a key extension that we see as foundational to many of our reports.”
Summary
Savage X Fenty is an excellent example of the value extensions can bring to a fashion company’s day-to-day analysis and reporting. Thanks to the user-friendliness and self-service of SuperTables and PictureThis, even creative stakeholders feel comfortable using the Tableau dashboards.
About Savage X Fenty
TechStyle Fashion Group is the pioneer online global fashion incubator. They partner with artists and style leaders to create the world’s most innovative and influential global brands and disrupt the fashion industry.
Savage X Fenty is a global lingerie, innerwear and apparel brand founded by Rihanna that champions confidence and inclusivity and is designed for all genders, sizes, and backgrounds.With accessible price points and an extensive range of fashion-forward styles, the brand celebrates fearlessness, confidence and inclusivity.
