Use Excel-like features without leaving Tableau
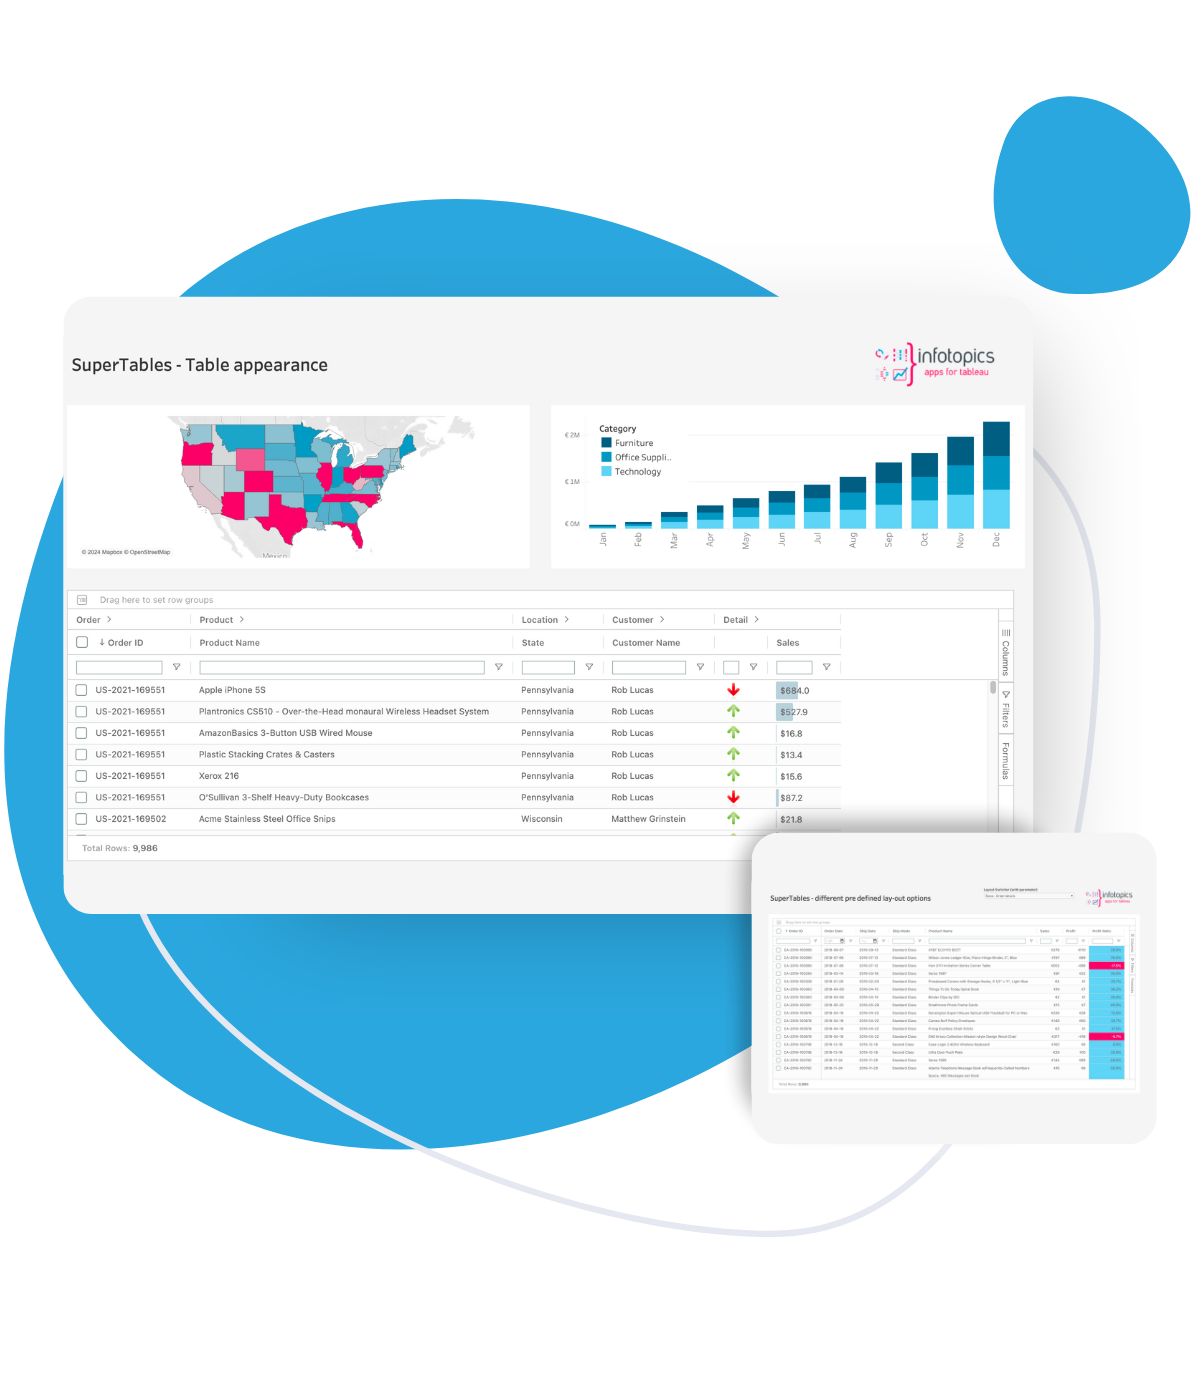
With the SuperTables Extension for Tableau and Power BI, you can offer your dashboard users the power of interactive and dynamic Excel-like tables that allow users to decide how to organize and analyze their data in a flexible grid using the features just like in Excel without leaving Tableau. Enrich your dashboards with the SuperTables Extension for Tableau and allow your users to do their own analysis with the summarized data of your visualizations.
“I have over a thousand users on Tableau, and we are still growing at a rapid pace. SuperTables has made Tableau so much more accessible to people that are used to Excel and have raised their game for how they think about data and analytics at our company. Because it’s so easy to use, even savvy business users are able to incorporate it in a matter of minutes.”
– Krystin Kim, Sr. Director, Decision Science at Postholdings
Learn from real-life use cases.
SuperTables in action with pre-built solutions.
This is an in-depth analysis of banking loan performance across various types powered by SuperTables and PowerKPIs. The first dashboard offers detailed insights, allowing users to filter and explore key metrics like credit score, interest rates, and remaining balances. The second dashboard provides a high-level summary of loan status, trends, and borrower demographics, helping financial institutions track loan health, manage risks, and easily make data-driven decisions. It's a comprehensive solution for strategic insights and efficient loan portfolio management.
We understand the numerous responsibilities you manage, from optimising your website to monitoring performance metrics. That's why we've developed PowerKPIs—to streamline your decision-making process and make your job easier.
Unlock the world of global game sales with our ShowMeMore Tableau dashboard! Dive into North America, Japan, and Europe's gaming trends using a radar chart and supertable for a quick, insightful adventure. Elevate your understanding of sales distribution and genre dynamics.
“Now, users don’t have to go back to either the BI or my team and ask us to build specific tables for their needs. They have the flexibility to do it themselves with SuperTables.”
– Selma Dogic, Data & Analytics at Carter’s
Download the FREE whitepaper.
Learn how to supercharge your Tableau Dashboards with SuperTables.
Revolutionize your data with trusted partners.
The Apps for Tableau partner network is a trusted and experienced team of consulting and reseller partners, dedicated to serving professionals worldwide in their native language.
Discover how SuperTables can revolutionize the way you handle data, enabling you to make better-informed decisions and achieve remarkable outcomes in your industry. Locate one of our trustworthy partners and start optimizing your data-driven journey.
FAQ
Yes, you can request more information on the pricing page.
Yes, you can request more information by filling in the form on the pricing page.