Workbooks Gallery
Pre-built workbooks for the finance industry.
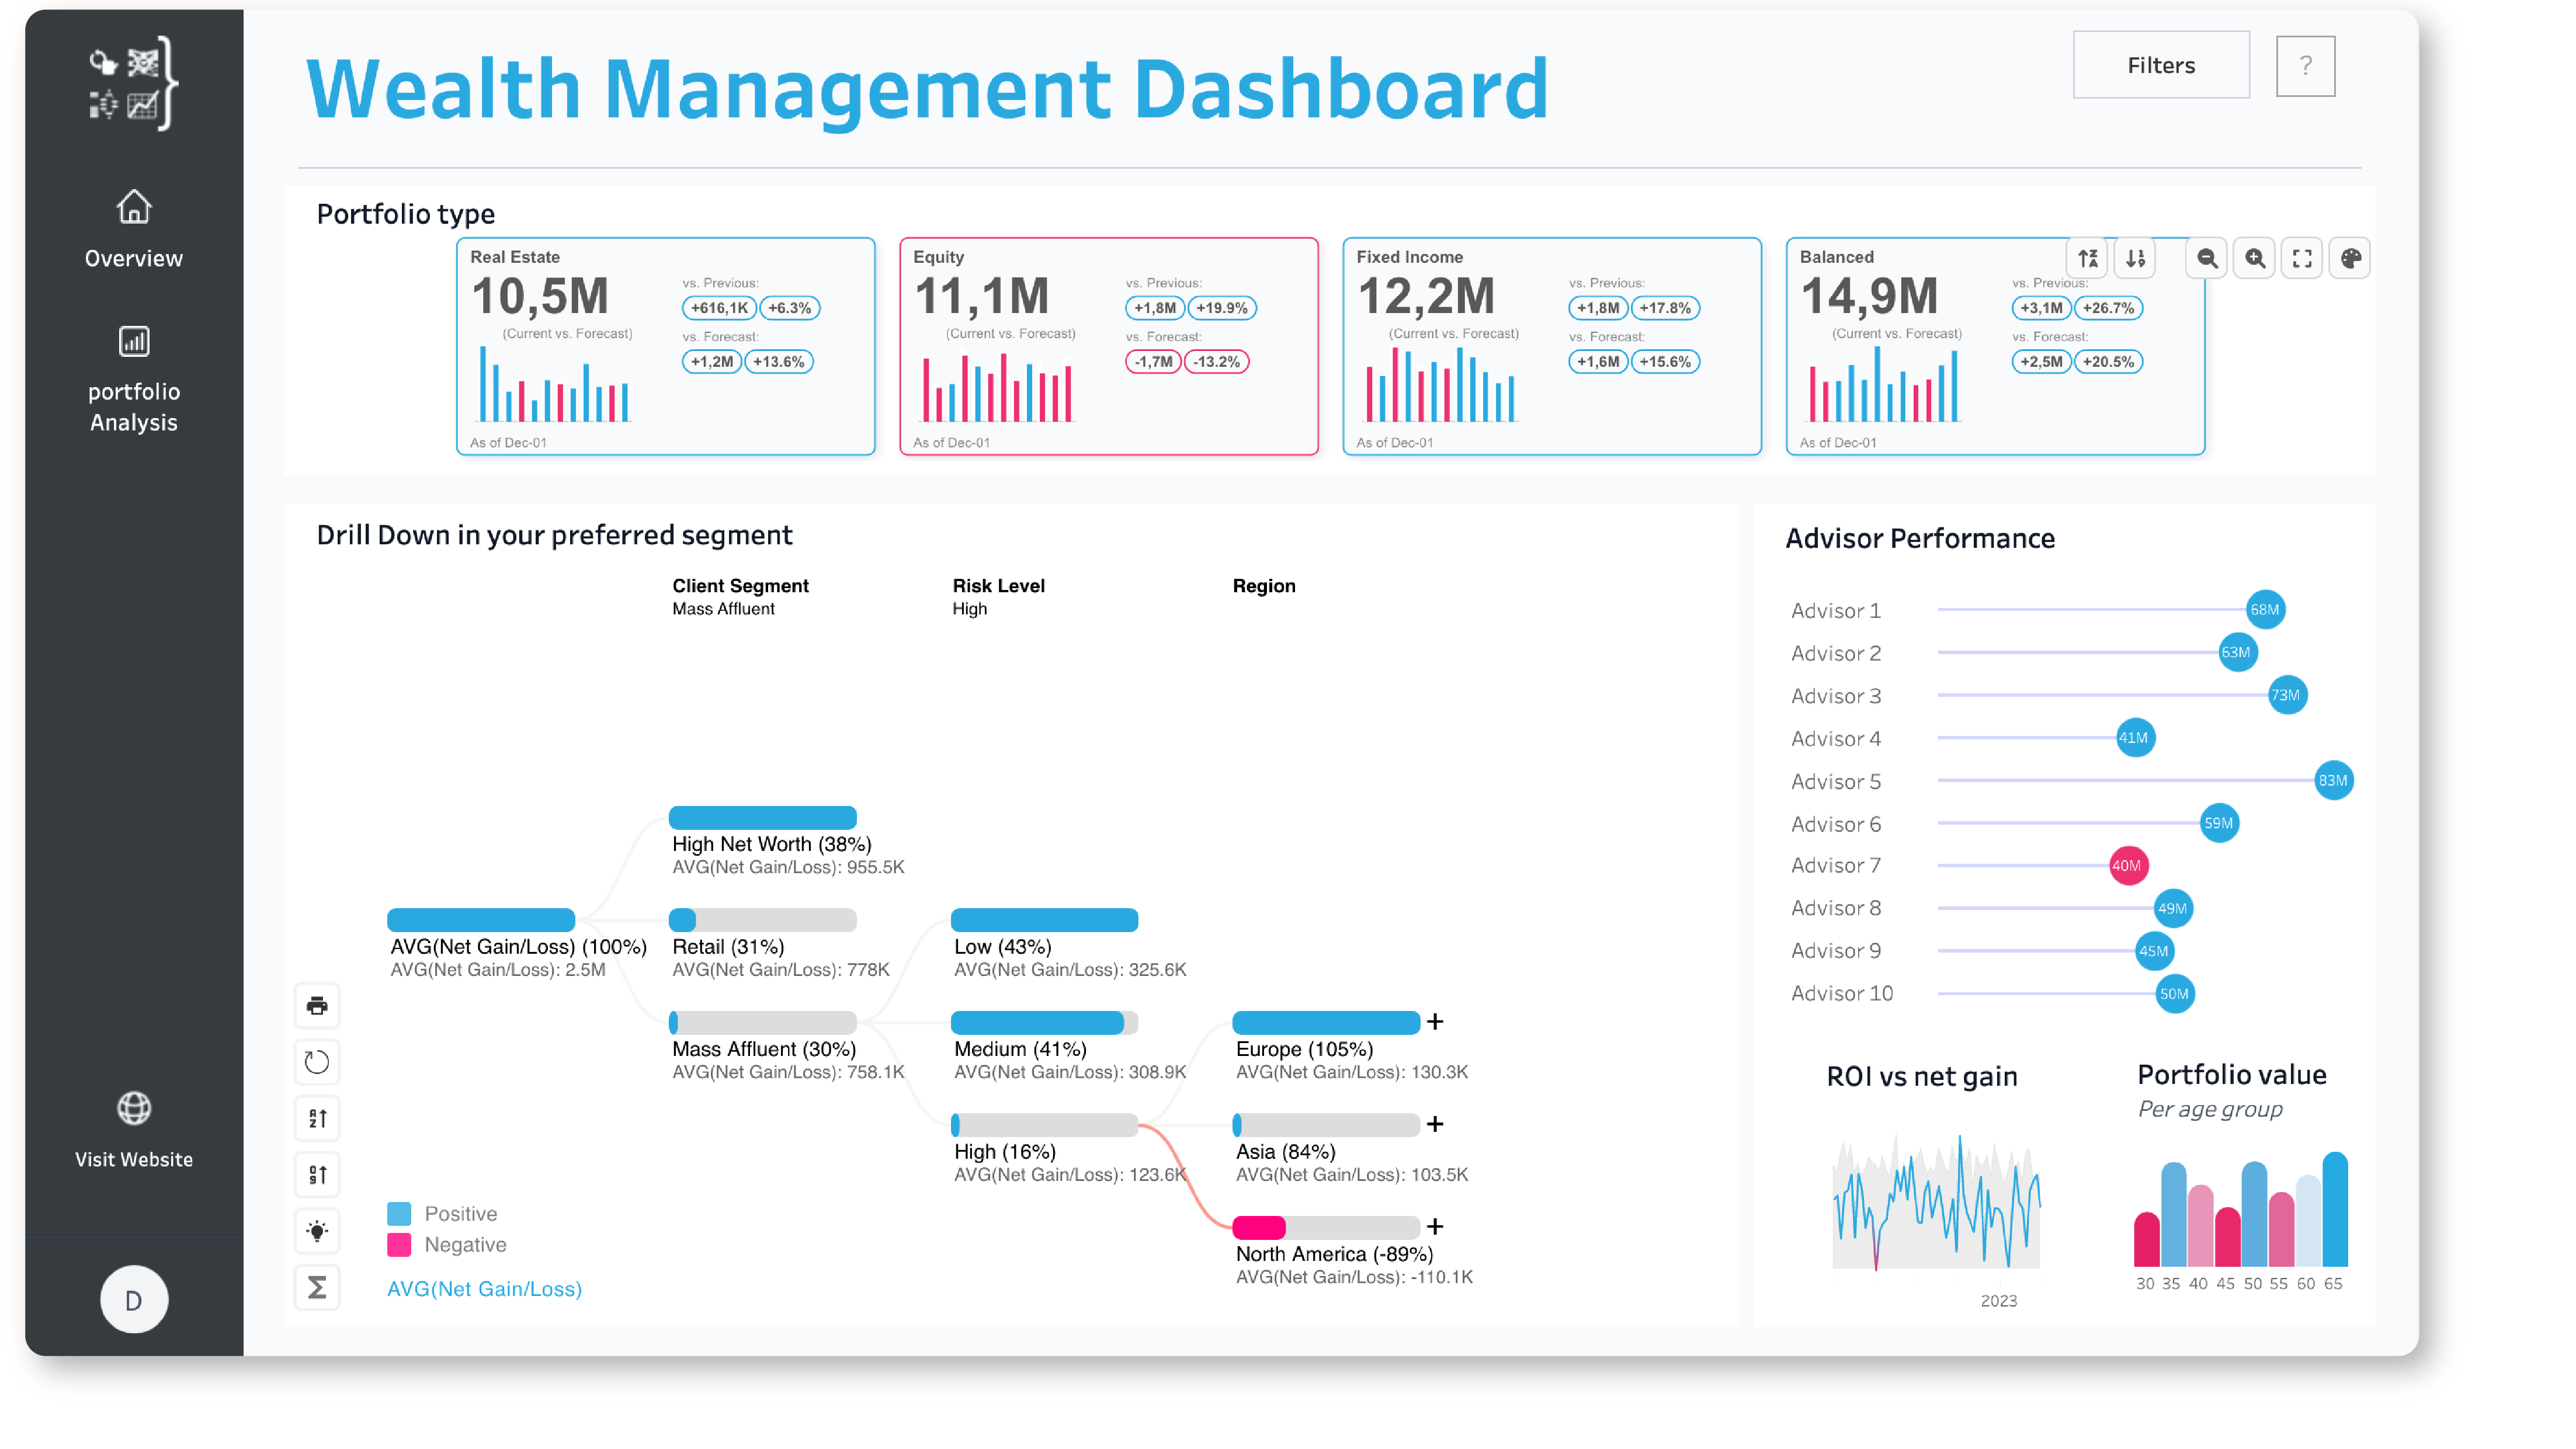
The Wealth Management Dashboard provides comprehensive portfolio insights through intuitive visualizations. This solution empowers wealth managers to analyze their investment portfolios in-depth, and uncover key trends to make informed decisions. Download to experience the power of Waterfall chart, PowerKPIs and DrillDownTree.

Transform your insurance analytics with this powerful, ready-to-use Insurance Portfolio Dashboard! Designed to simplify complex data and drive actionable insights, this solution helps you monitor key metrics like customer retention, profitability, and policy performance—all at a glance. By combining Tableau's native capabilities with advanced extensions like SuperTables and PowerKPIs, this dashboard offers unmatched clarity and flexibility for data-driven decision-making. Whether you're tracking churn rates, analyzing broker performance, or visualizing profitability trends, this dashboard is your all-in-one tool for success. Download it now and start making smarter, faster decisions for your insurance portfolio!
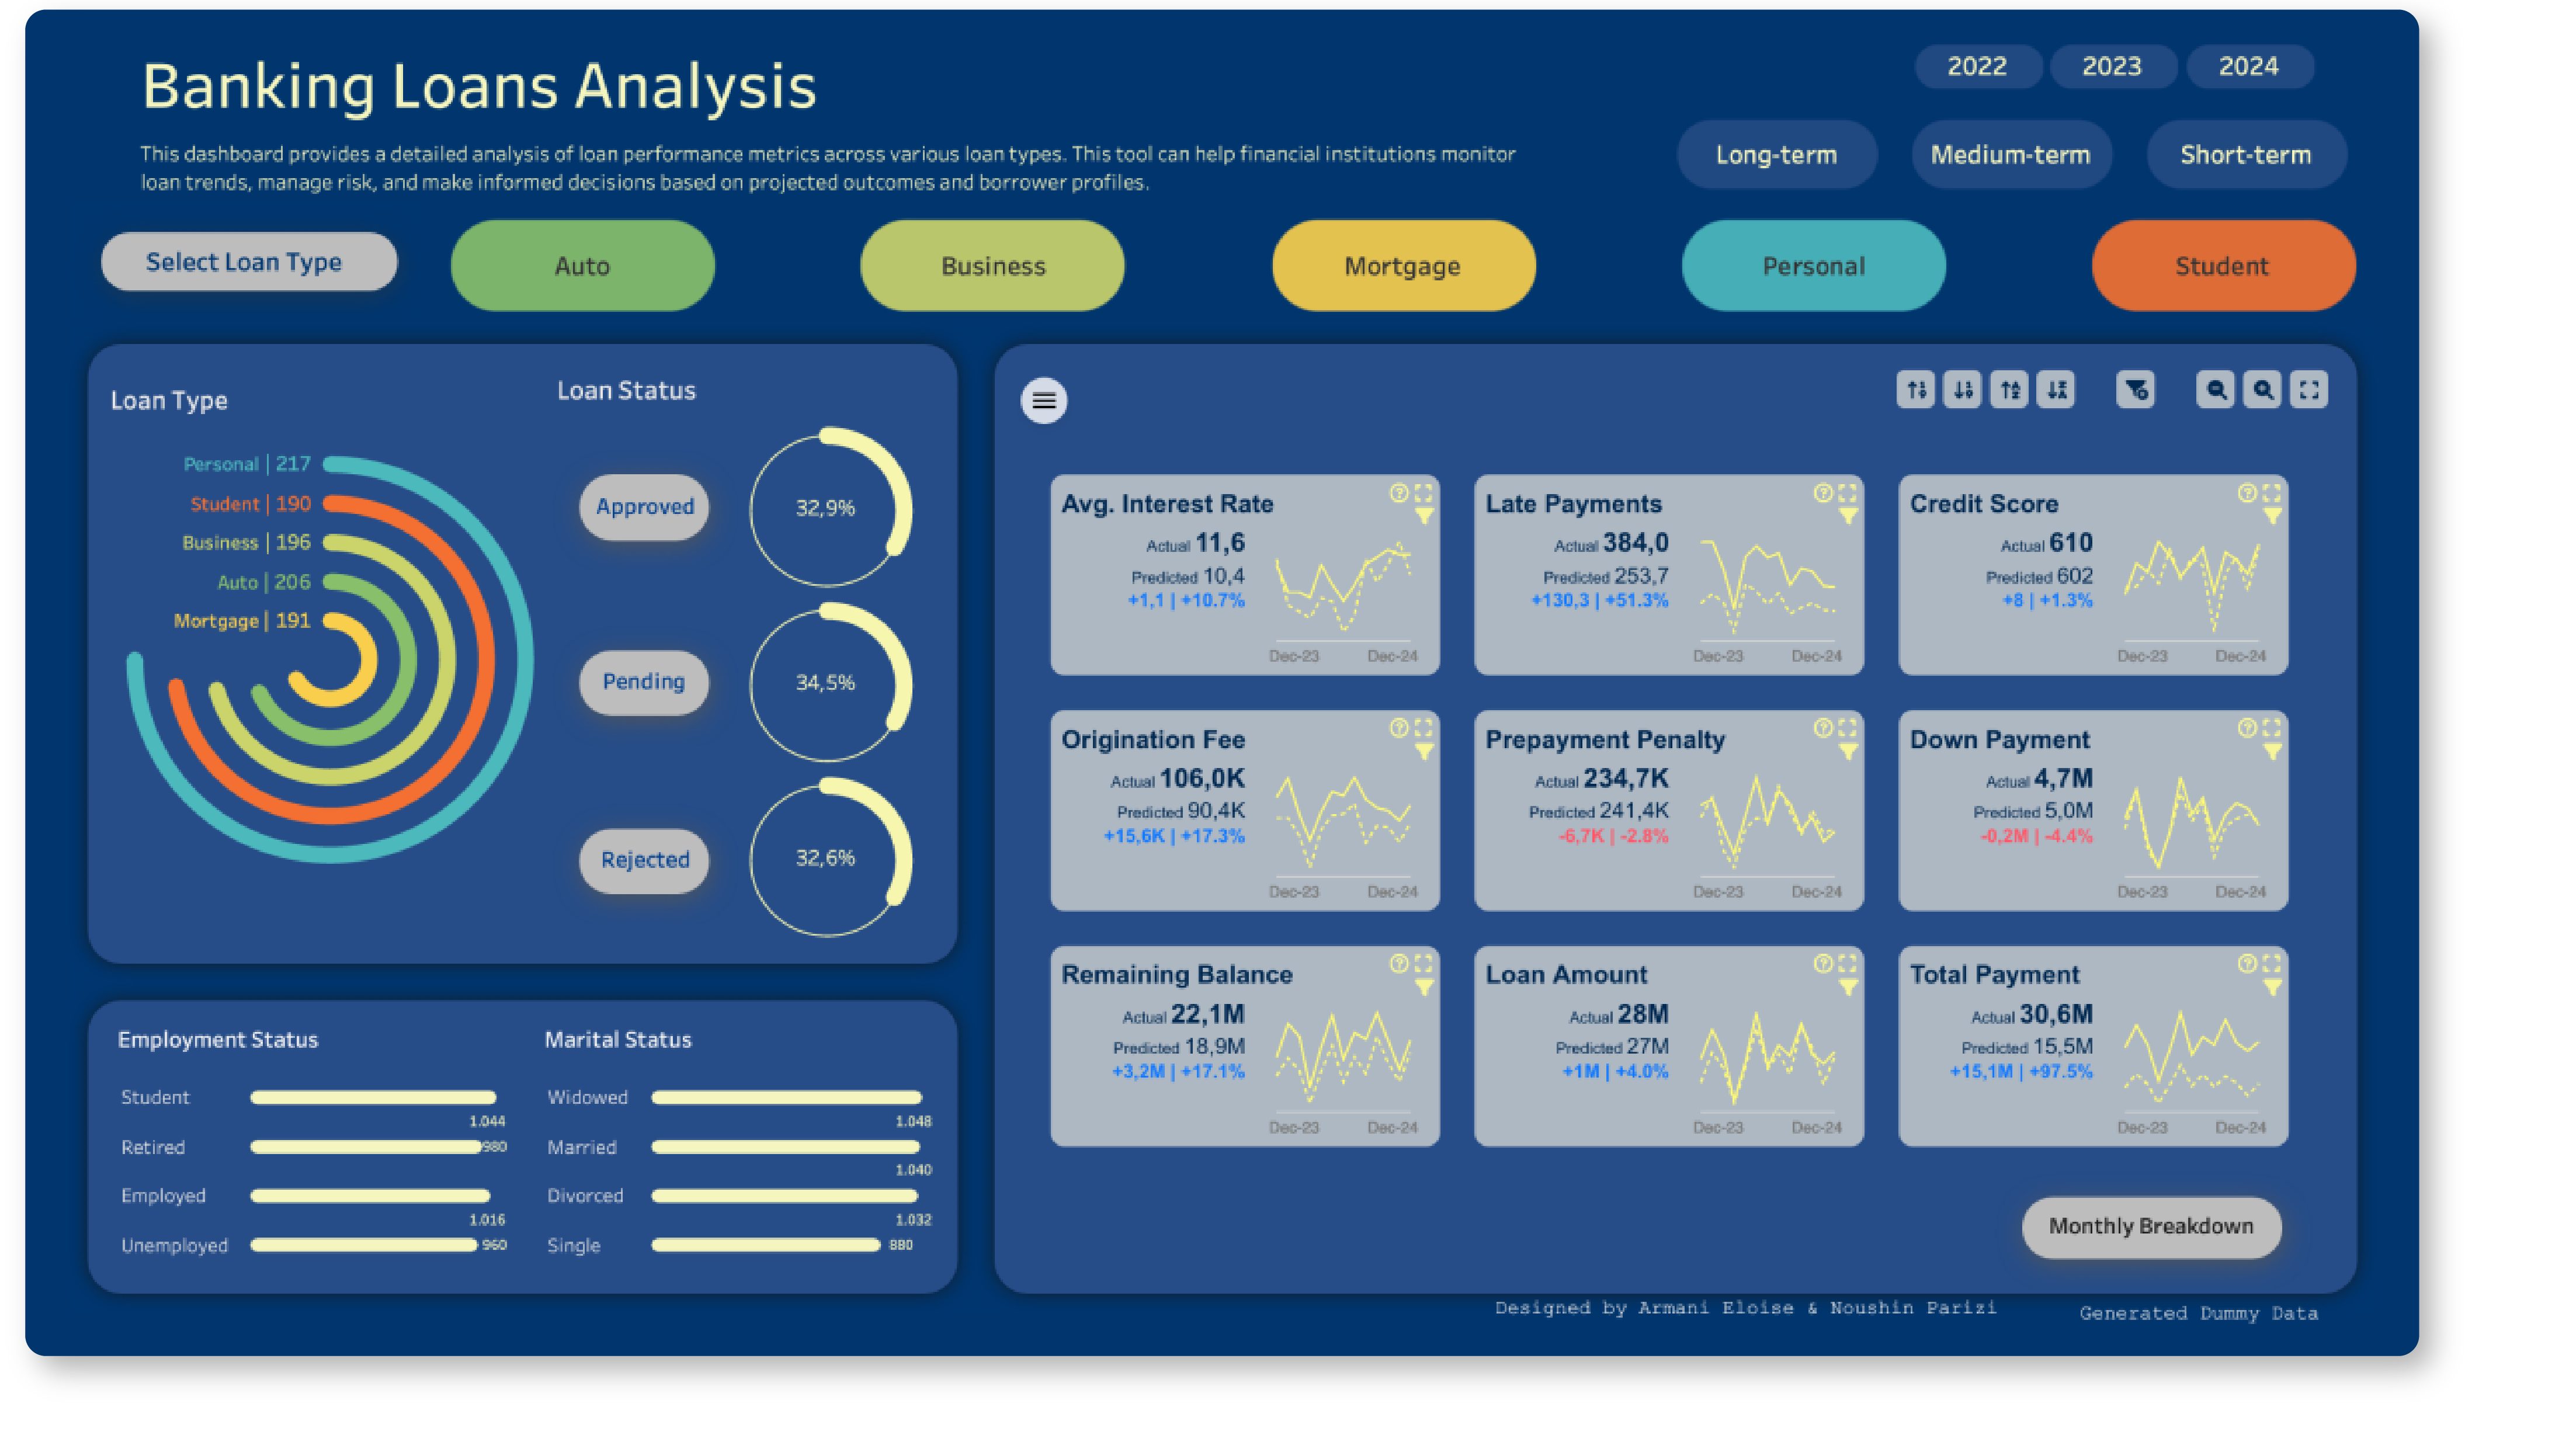
This is an in-depth analysis of banking loan performance across various types powered by SuperTables and PowerKPIs. The first dashboard offers detailed insights, allowing users to filter and explore key metrics like credit score, interest rates, and remaining balances. The second dashboard provides a high-level summary of loan status, trends, and borrower demographics, helping financial institutions track loan health, manage risks, and easily make data-driven decisions. It's a comprehensive solution for strategic insights and efficient loan portfolio management.

We understand the numerous responsibilities you manage, from leading teams to monitoring performance metrics. That's why we've developed PowerKPIs—to streamline your decision-making process and make your job easier.

This solution for financial statements offers dynamic dashboards for real-time monitoring, strategic resource allocation, and scenario modelling. Easily explore “What-If” scenarios, monitor financial health in real-time, and optimize resource allocation game-changing capabilities in SuperTables. Use the ShowMeMore Waterfall Chart to model various financial scenarios, from cost reductions to market expansions, making informed choices. Uncover opportunities and address risks with this solution.

Supercharge your marketing campaigns with our Tableau Marketing Campaign solution, the key to unlocking real-time insights and maximizing ROI. Utilize the intuitive DrillDownTree for in-depth exploration; The DrillDownTree functionality empowers you to delve deeper into campaign specifics, facilitating a granular understanding and strategic refinement of your marketing initiatives. The Marketing Campaign Analysis dashboard is your secret for actionable insights, enabling data-driven decisions and optimizing campaign effectiveness. Elevate efficiency, enhance decision-making, and embrace the power of data-driven marketing with Tableau.