Workbooks Gallery
Pre-built workbooks for the retail industry.
Enrich your dashboards with dynamic product images or example thumbnails right from your dataset. Your dashboards never looked this appealing!
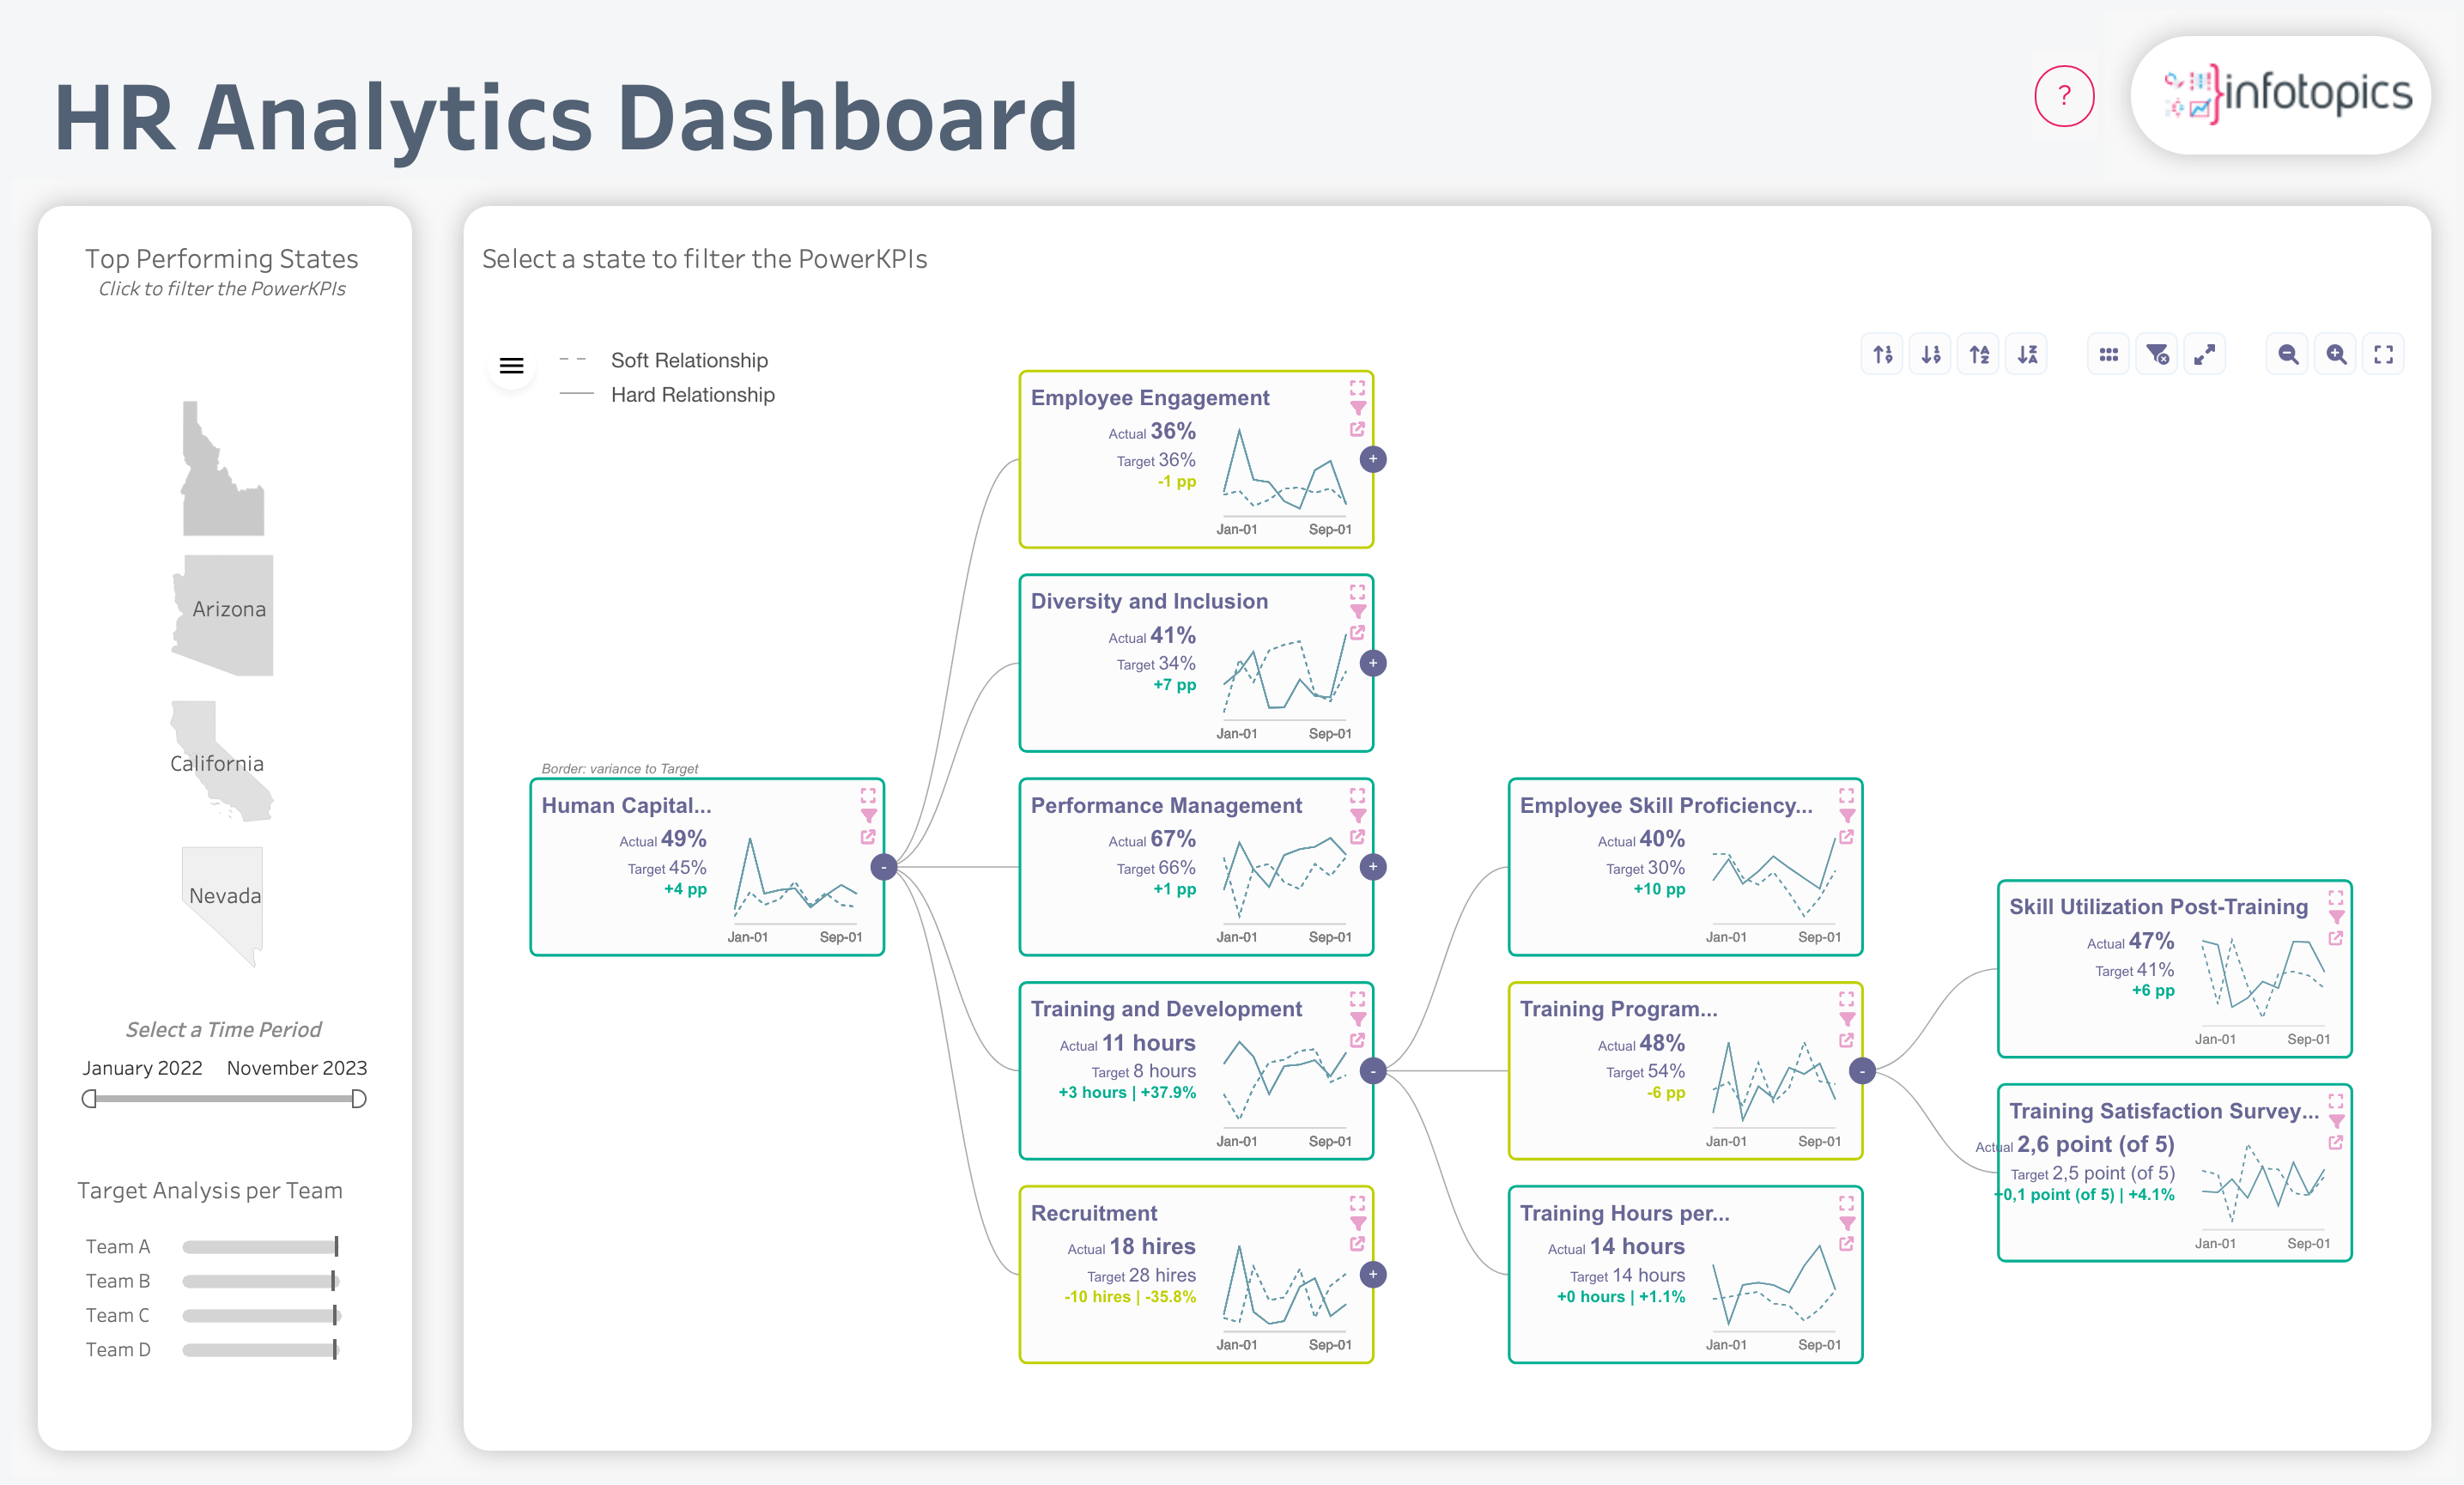
We understand the numerous responsibilities you manage, from leading teams to monitoring performance metrics. That's why we've developed PowerKPIs—to streamline your decision-making process and make your job easier.
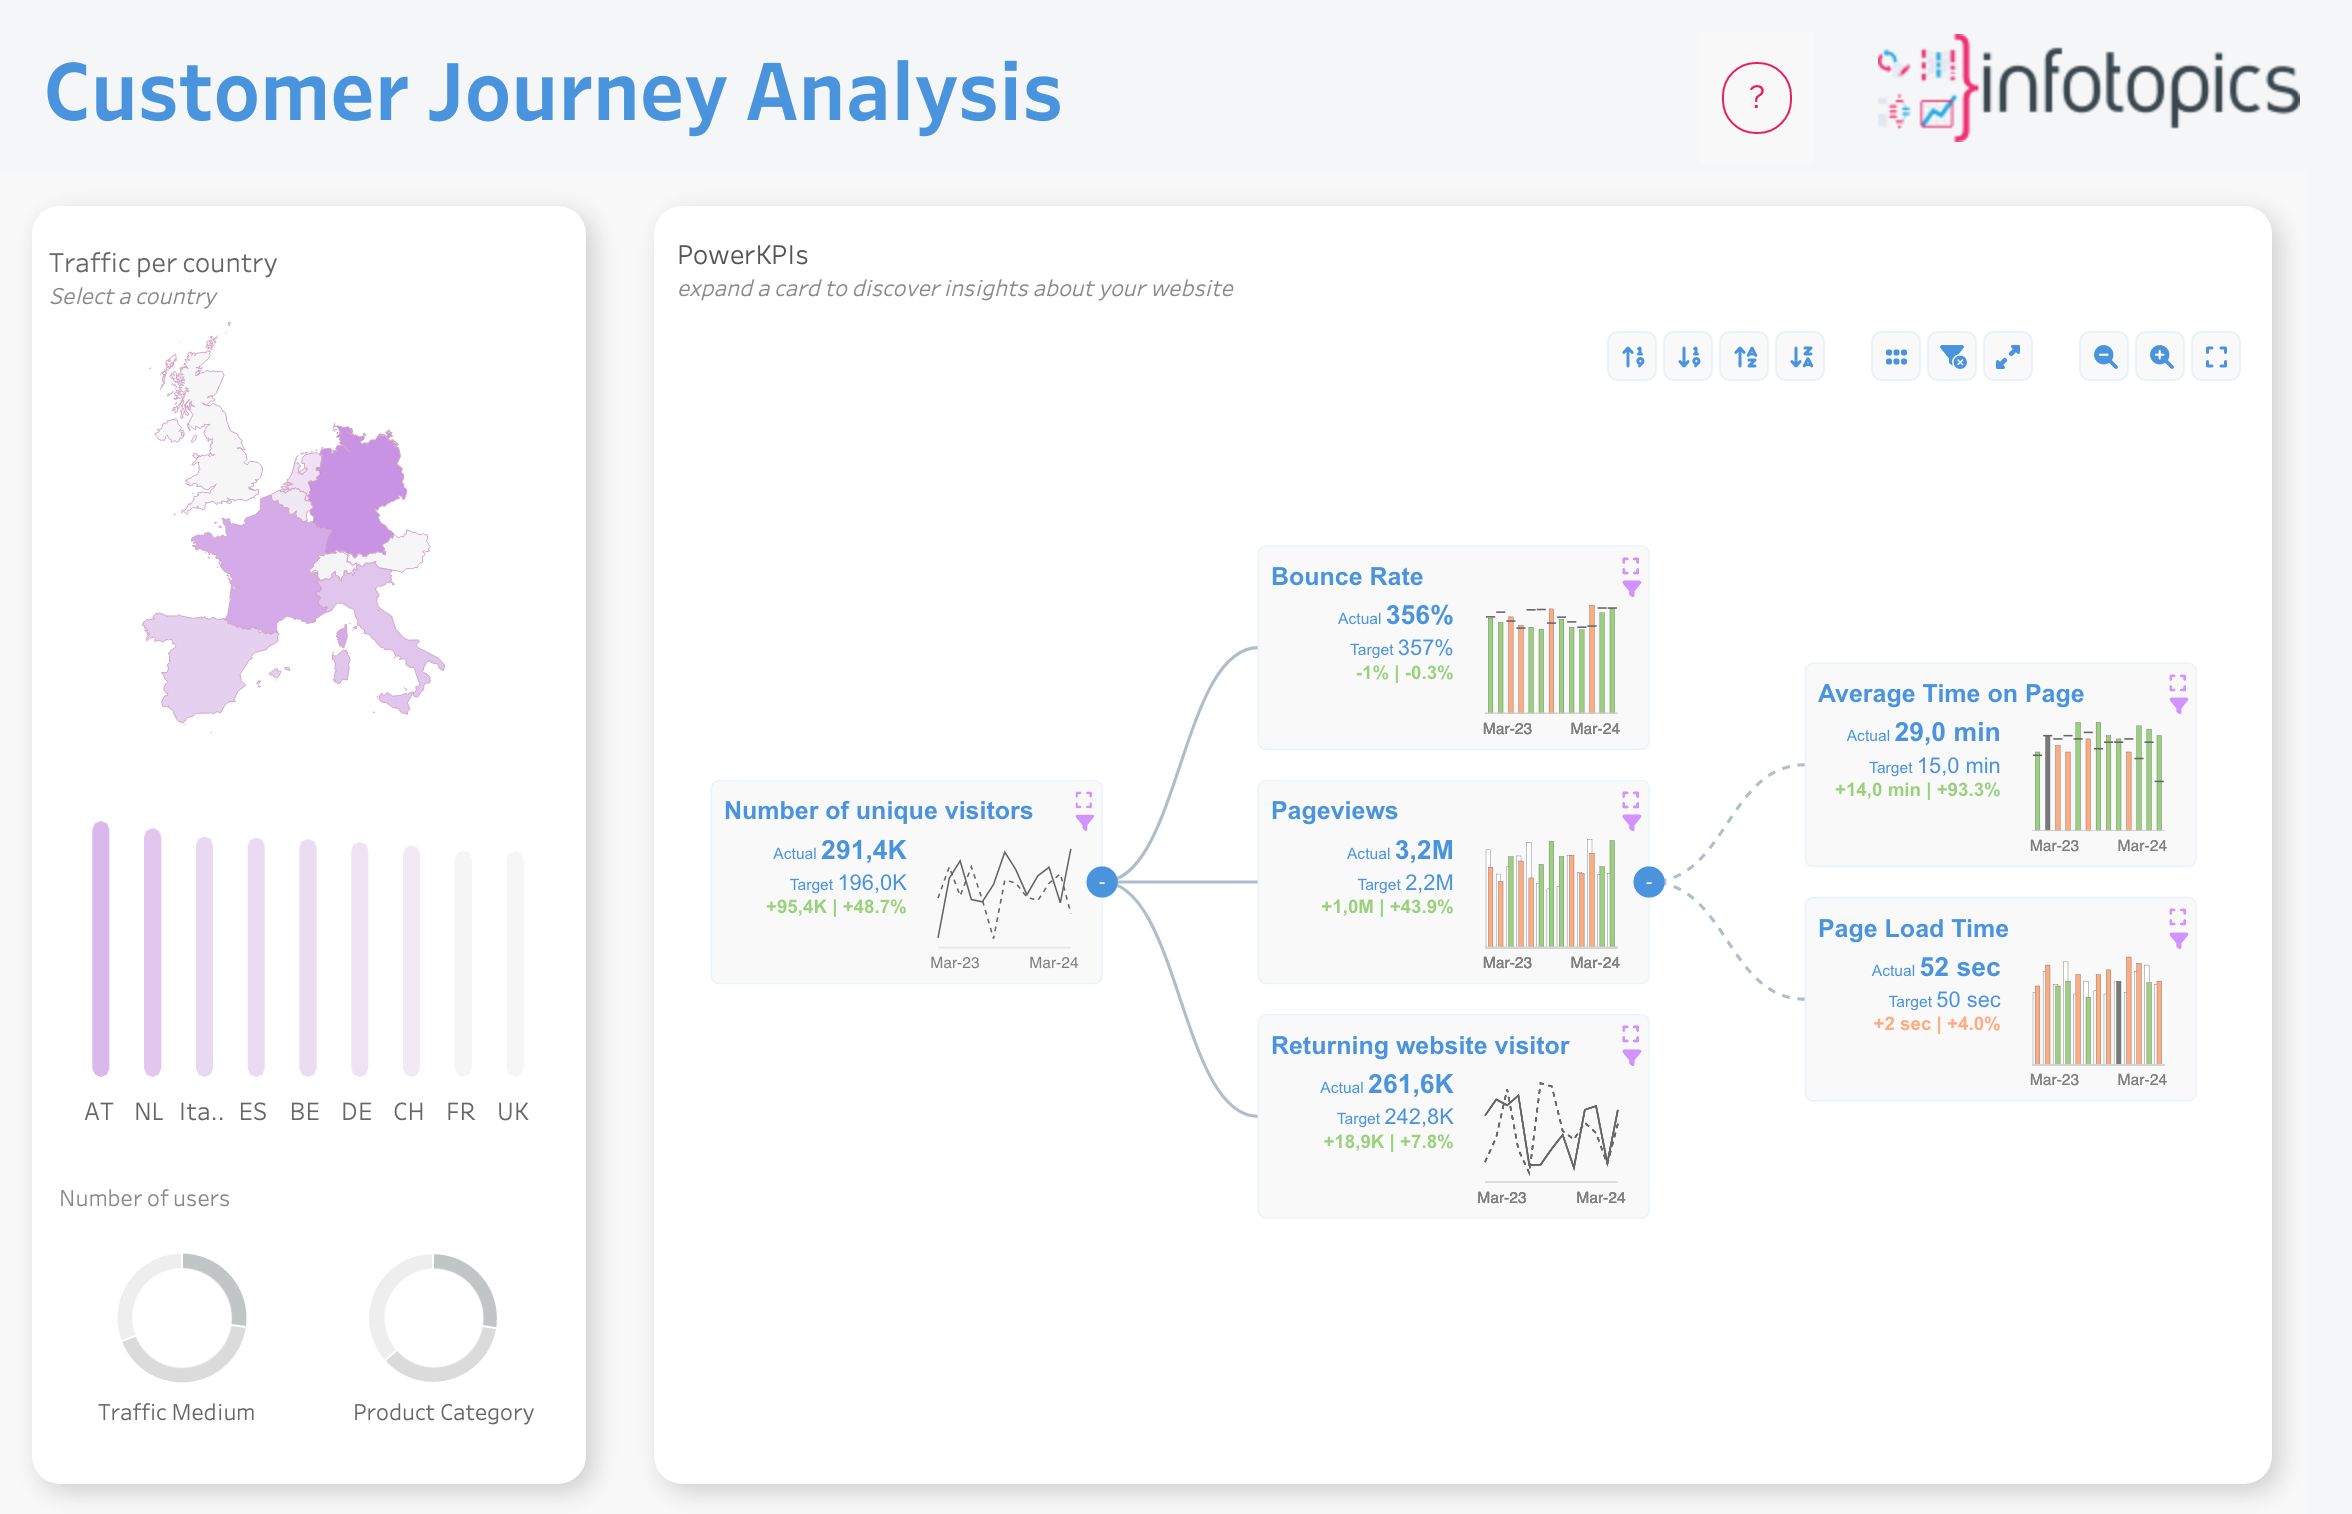
We understand the numerous responsibilities you manage, from optimising your website to monitoring performance metrics. That's why we've developed PowerKPIs—to streamline your decision-making process and make your job easier.
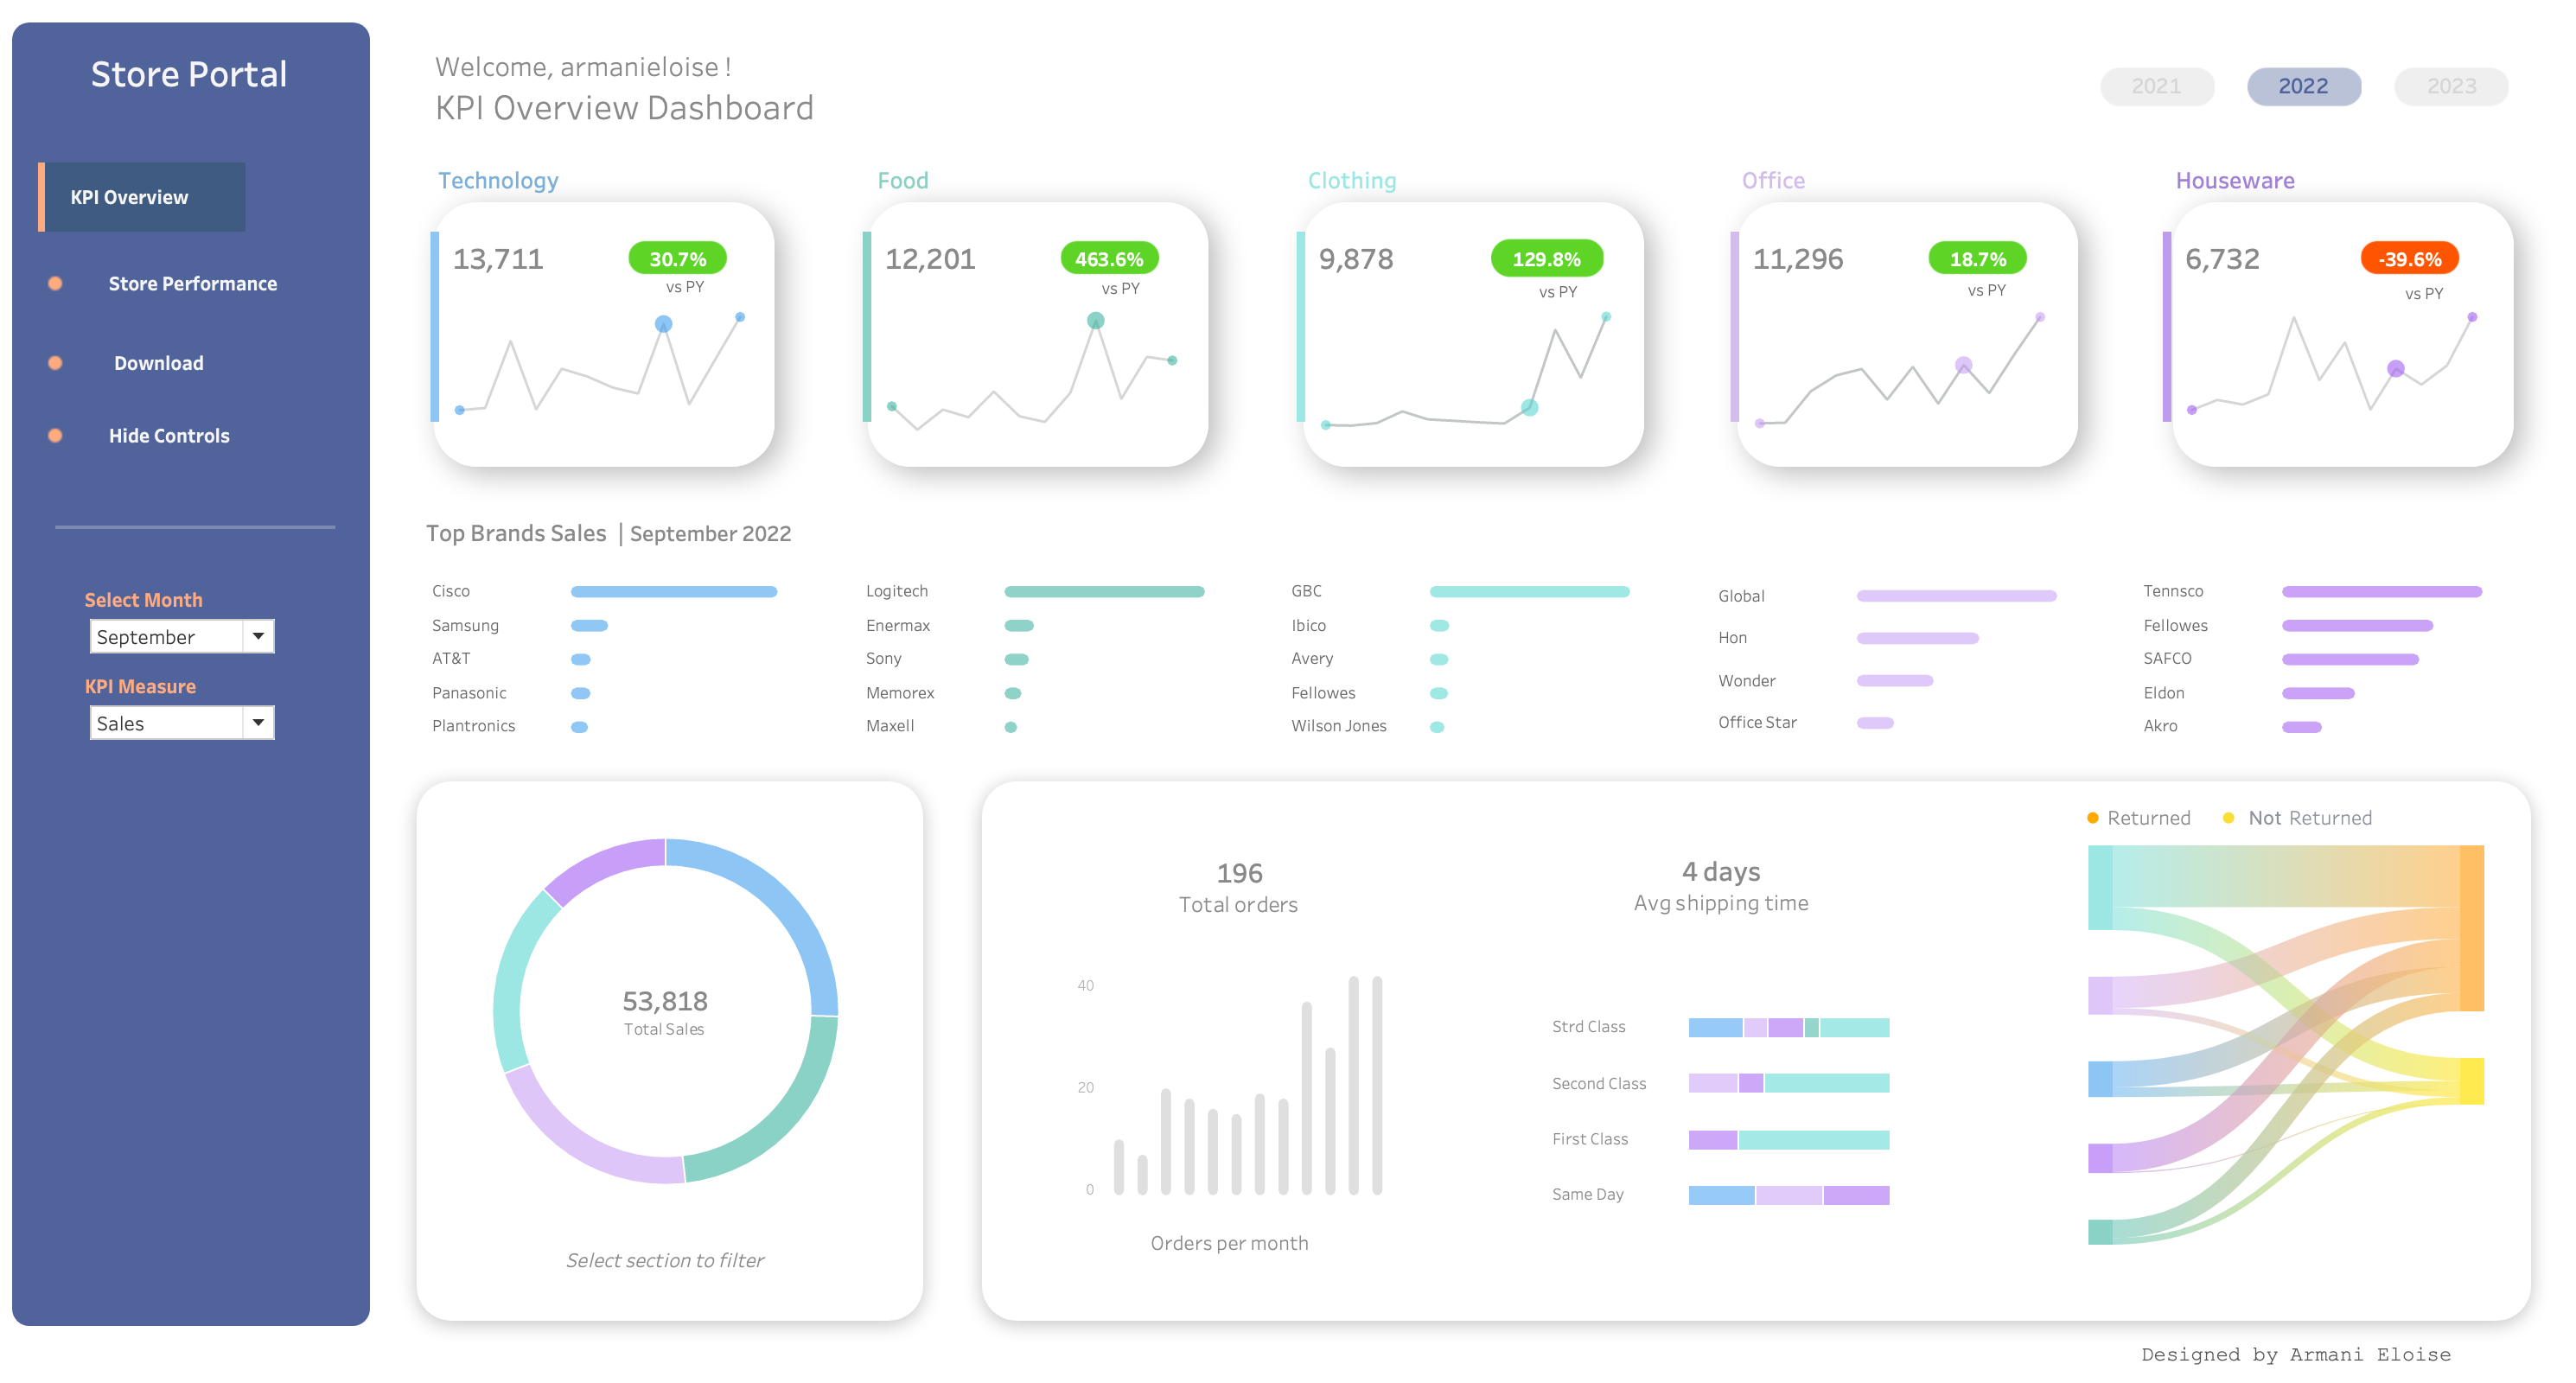
Elevate your business insights with our Retail Store Performance Dashboard, a powerful solution that effortlessly tracks year-over-year performance across departments. Instantly toggle between years and gain a quick overview of top brands. The customizable Showmemore extension offers a comprehensive view of returns and non-returns. With sleek parameter selections, effortlessly switch between sales and profit views. Accessible through a user-friendly portal interface, this versatile solution adds precision and style to your retail analytics, unlocking deeper insights and maximising your retail success.
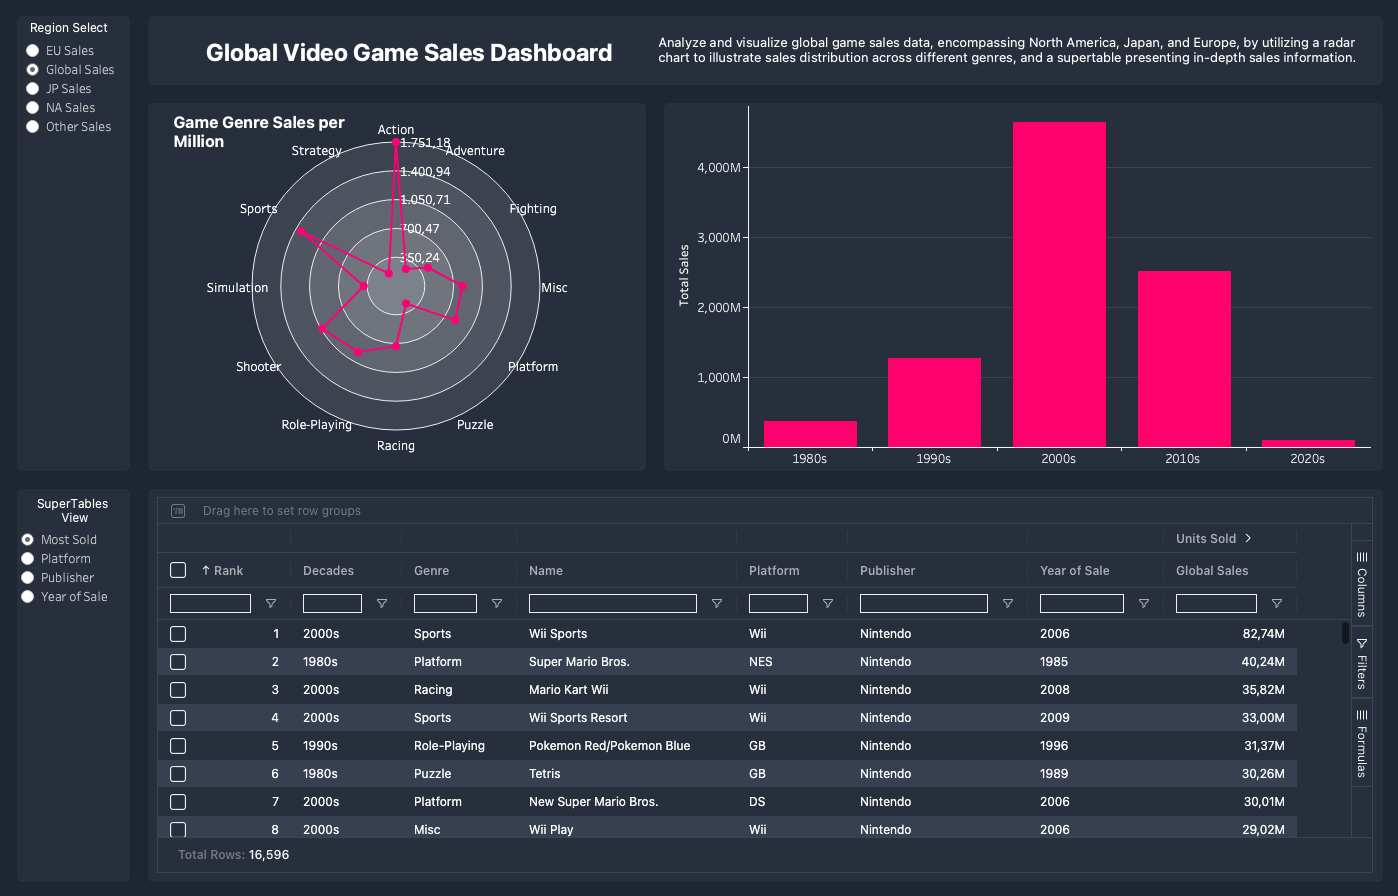
Unlock the world of global game sales with our ShowMeMore Tableau dashboard! Dive into North America, Japan, and Europe's gaming trends using a radar chart and supertable for a quick, insightful adventure. Elevate your understanding of sales distribution and genre dynamics.
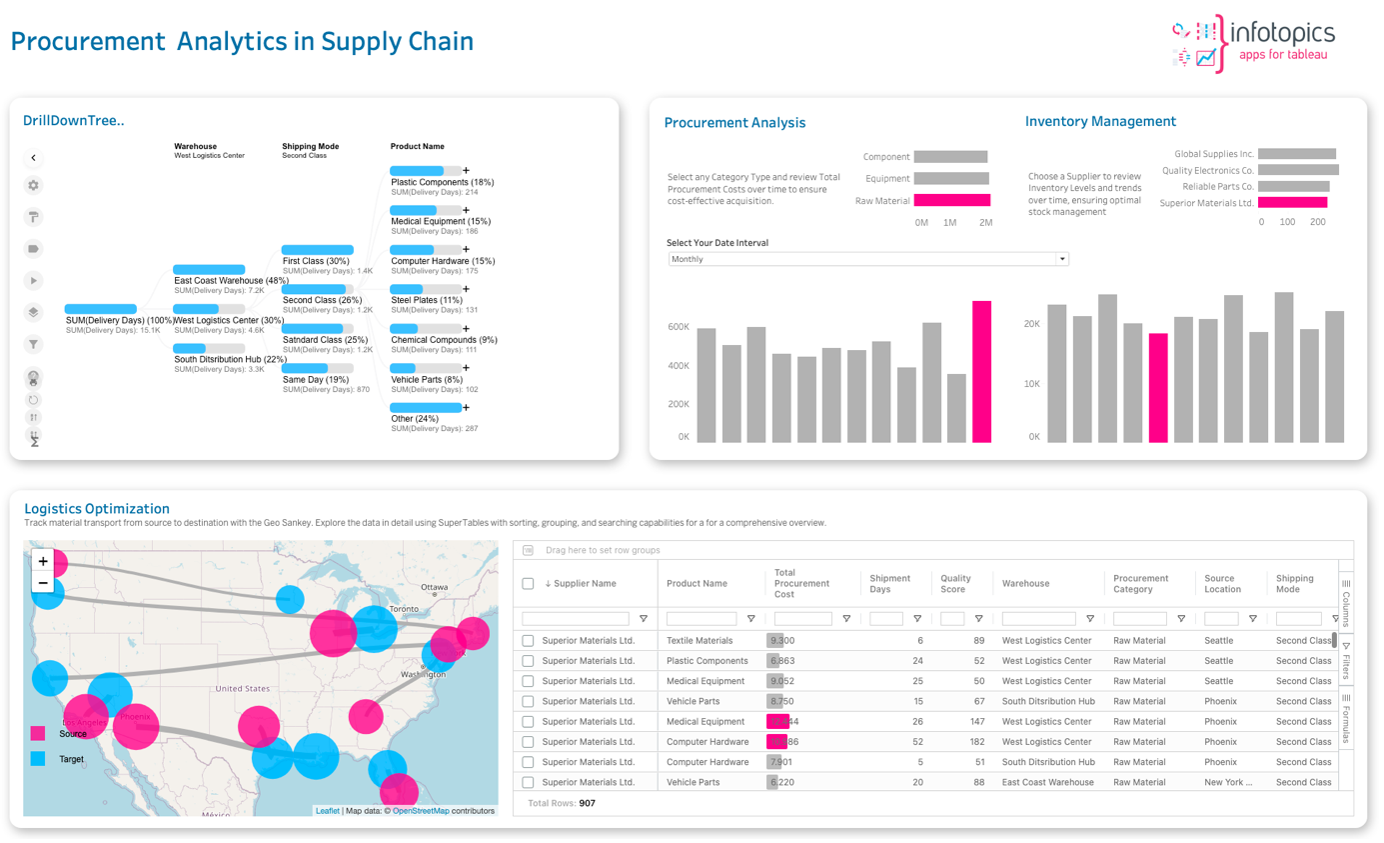
Explore this solution to simplify the complexities of supply chain management. Whether you're in manufacturing or logistics, this dashboard is tailored for you. With an intuitive overview and DrillDownTree, it offers insights into your entire supply chain. The Performance Metrics Dashboard tracks key metrics, and Geo Sankey visualizes material flow for optimized transportation routes. SuperTables at the bottom right create a user-friendly space for easy exploration, streamlined logistics, enhanced category-based performance, and informed decision-making. This dashboard, powered by extensions, adds immense value by providing insights for a seamless supply chain operation.
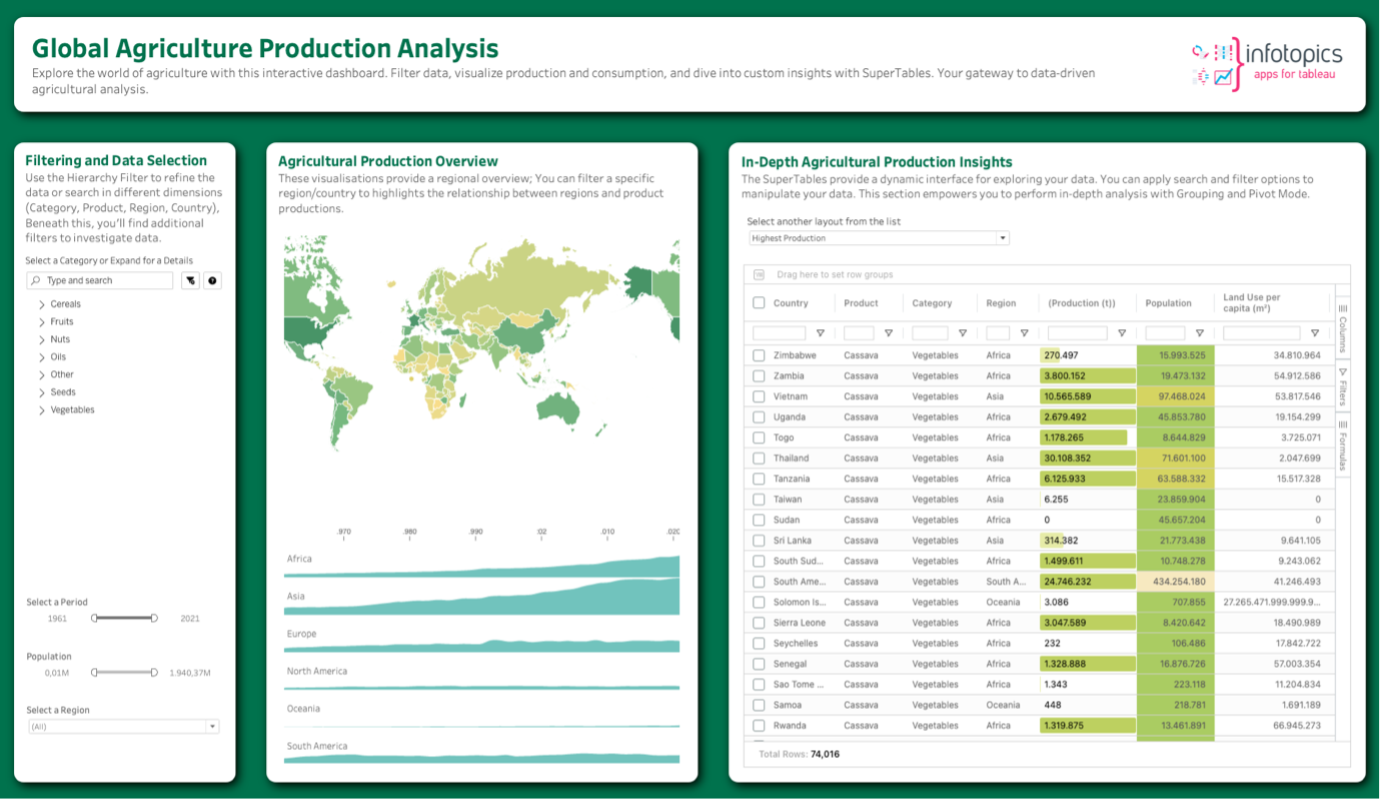
Explore the world of agriculture through our dynamic dashboard. Use the Hierarchy Filter for seamless data refinement, and discover regional insights with the interactive map and horizon chart from ShowMeMore. Uncover valuable agricultural trends effortlessly. Plus, the SuperTables on the right offer in-depth analysis with flexible layouts, empowering you to make informed decisions. Download now to dive into a wealth of data-driven decision-making.

