How to turn your information into images everyone recognizes?
Visualizations are a great way to present data engagingly, but there are some ways to make them even more effective. Images in Tableau visualizations can be incredibly helpful in understanding and reading data. With images, data can be easily presented, allowing the viewer to identify trends, outliers, and other key elements quickly. Additionally, images can highlight important points or draw attention to certain aspects of the data, allowing us to compare different data points and highlight important factors in a data set. When used correctly, images in visualizations help to understand and interpret complex data sets more accessible and make informed decisions.
Let me tell you a short story about how we can deal with complex data sets and information:
It’s probably a barcode, but I can’t tell for sure.
There was once a team of warehouse people who knew all the products, but they constantly had to scan the barcodes when it came to stocking the shelves or fulfilling orders. One day, they decided to make a game out of it. They would see who could identify the most products by their barcodes. The game quickly became a competition in the company. Shortly all the employees could identify products using barcodes, individual numbers, and letters. Soon, they could tell stories about the products just by looking at the barcodes.
Did it make sense? Of course not!
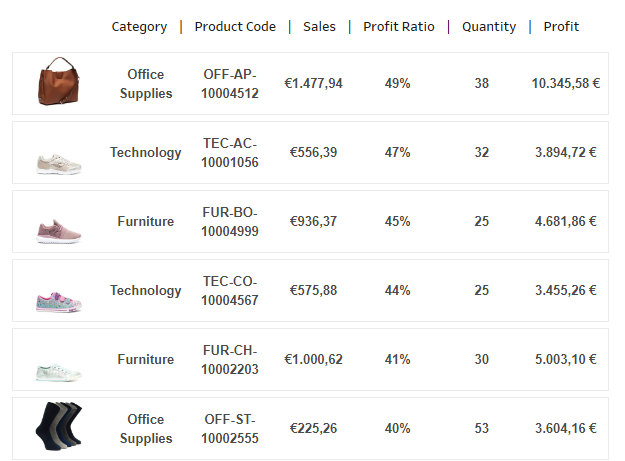
When it comes to numbers and barcodes, things can get complicated quickly. Numbers and product barcodes are barriers to efficiently communicating data and insights with the team. Barcodes can be particularly tricky to understand, as they are often used to concisely represent a lot of information. This can make it difficult to quickly and easily understand what the numbers or letters actually mean and what they represent. Decision-making based on this data is prone to errors and time-consuming, if not impossible. Moreover, numbers and product barcodes can be subject to change, making it difficult to keep track of the data over time.
An image is worth a thousand words in Tableau Dashboards.
Instead of a sea of barcodes and numbers, images leap out and grab your attention.
Images in Tableau can make analysis and decision-making much easier because they provide a visual representation of data; and help analysts to quickly identify patterns and trends or make effective decisions based on this information. Additionally, you can communicate complex data sets to stakeholders in a way that is easy to understand.
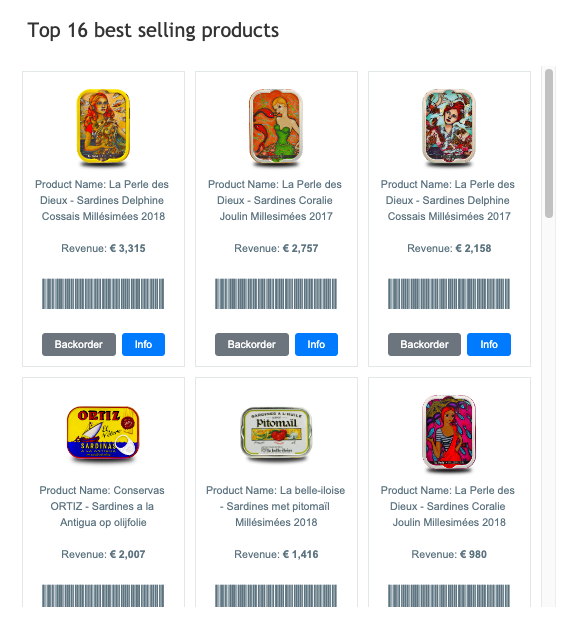
See your products in a new light with PictureThis.
There are multiple ways to bring images or illustrations into your Tableau dashboards. Still, in this article, I want to focus on one of the easiest and most effective ways of dealing with numerous products in data sets.
PictureThis makes it possible to have your images for products and see them in your analytics. Improved Decision-making, Saved Time, and Money are more accessible than ever with this powerful extension.
PictureThis enables you to not only filter your data with these images but you also have the URL action on pictures, and you can navigate to find more information within each image. This way, you can accurately see and show many relations in your data and impact revenue. Whether the question is how many of each product were sold or which products were the most popular, it is a matter of seconds for you to find it with your data. It is a great way to see your products in a new light and identify any trends.
The discussed issue was only one of many use cases for replacing complex data with images in Tableau Dashboards. If you are interested in more use cases with PictureThis, check these articles about how an investment company (Invesco) built a community with our solutions and How Savage X Fenty uses PictureThis to ensure an optimal user experience on their website.
We love to make solutions and help Tableau users to do things more efficiently. If you have feedback, ideas, questions or need support, please share them with us! Also, don’t forget to follow us on social media for our latest news and updates.