Trusted.
By 600+ companies in 150+ countries.
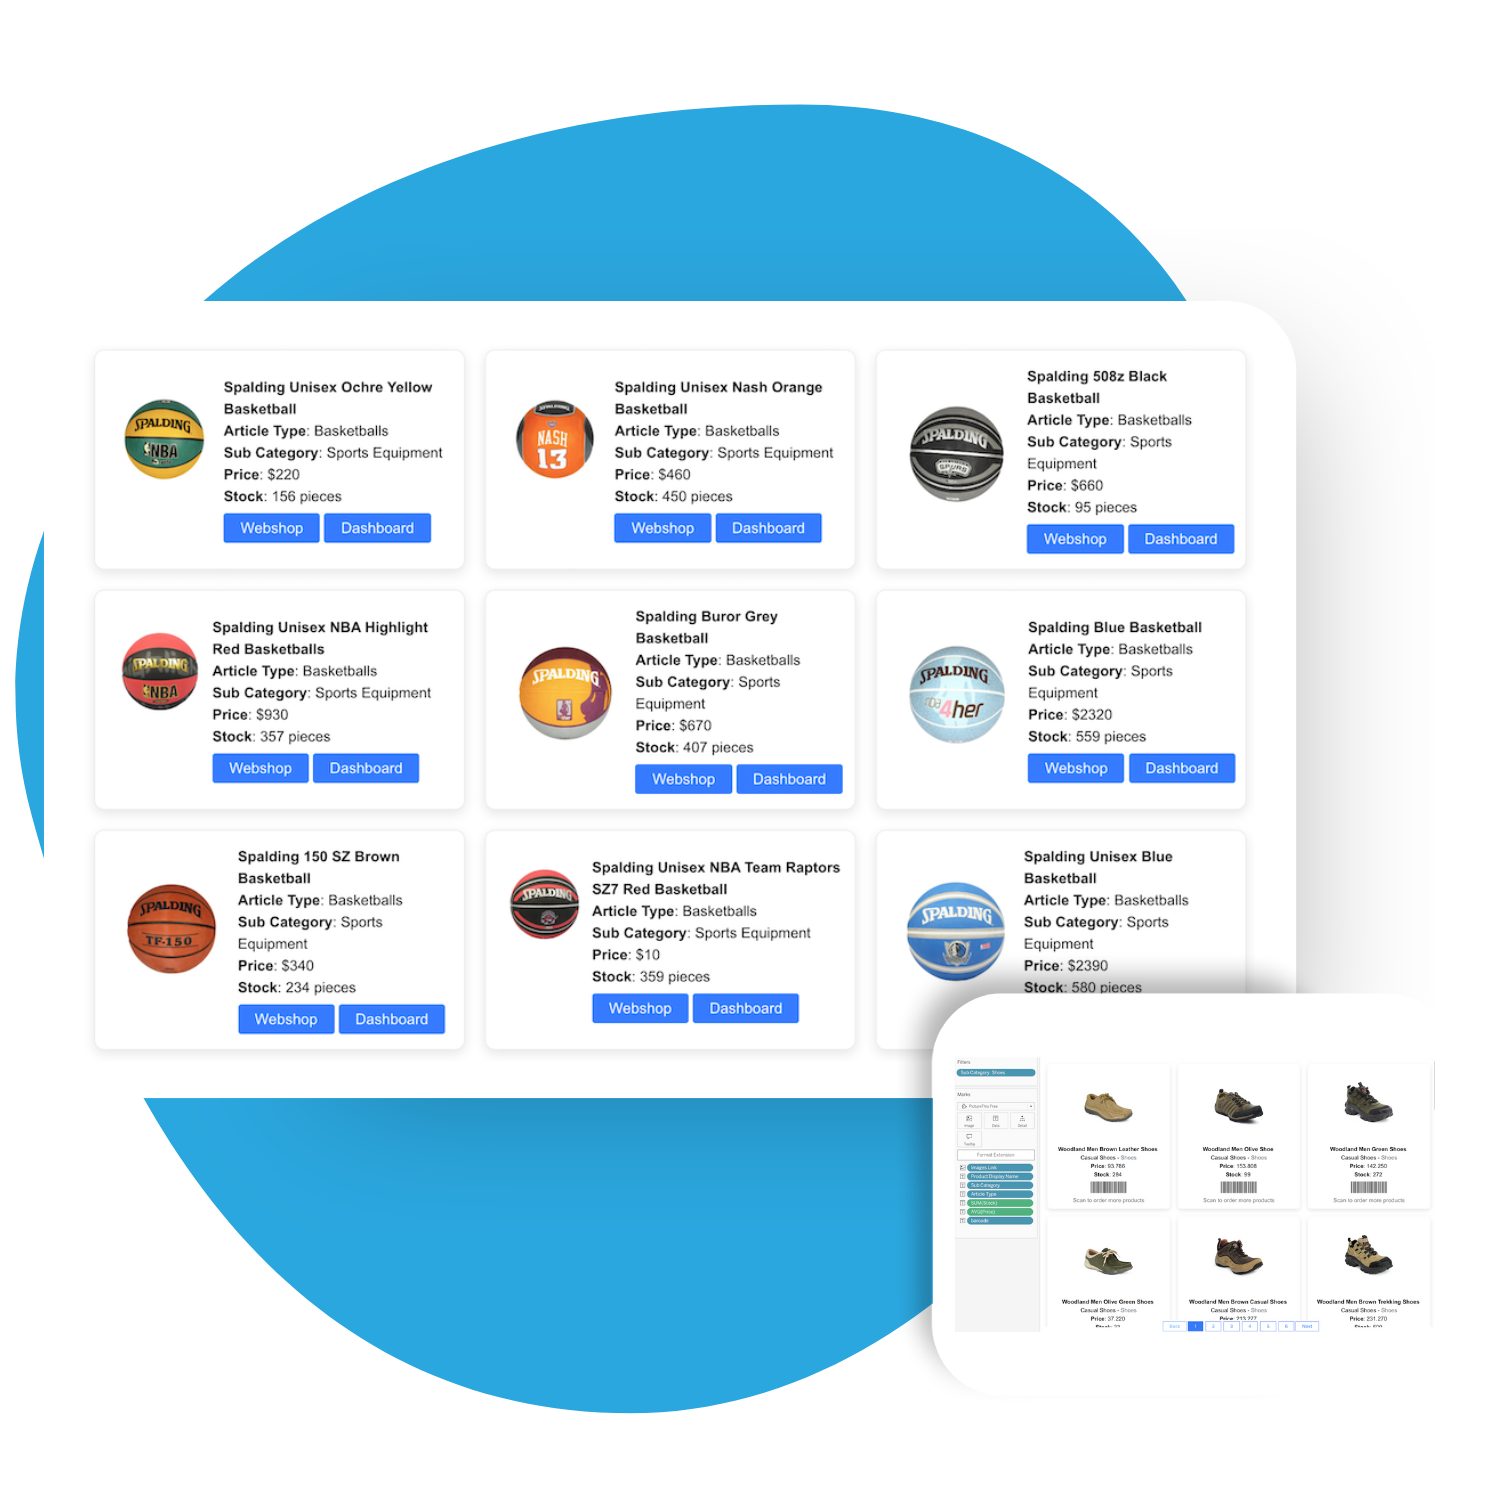
A picture is worth a thousand words.
Countless features for your use case.

“Our creative stakeholders feel much more empowered when they see the products in the photos. PictureThis helps bring our data to life in a very unique and efficient way. It is a key extension that we see as foundational to many of our reports.”
– Nadine Elway, Business Intelligence Manager at Savage X Fenty
“Our creative stakeholders feel much more empowered when they see the products in the photos. PictureThis helps bring our data to life in a very unique and efficient way. It is a key extension that we see as foundational to many of our reports.”
Nadine Elway, Business Intelligence Manager at Savage X Fenty
Learn from real-life use cases.
PictureThis in action with pre-built solutions.
MySQL Database Password: demodemo Check out the top 20 must-try restaurants in your area right here in Tableau! Just like your favourite food-ordering app, this interactive Tableau dashboard allows you to explore local spots, read real reviews, rate your dining experiences, and share your feedback. Powered with PictureThis and WritebackExtreme Extensions, this solution makes your experience easy and fun!
Explore our dynamic dashboard showcasing global electricity production, clean fuel accessibility, and energy consumption, with a focus on the Netherlands. Using innovative charts like horizon and Sankey, we offer a clear view of the world's energy landscape. Dive into shifting power generation sources, track clean fuel access, and monitor CO2 emissions from coal. download this dahsboard for understanding the complexities of our energy future.
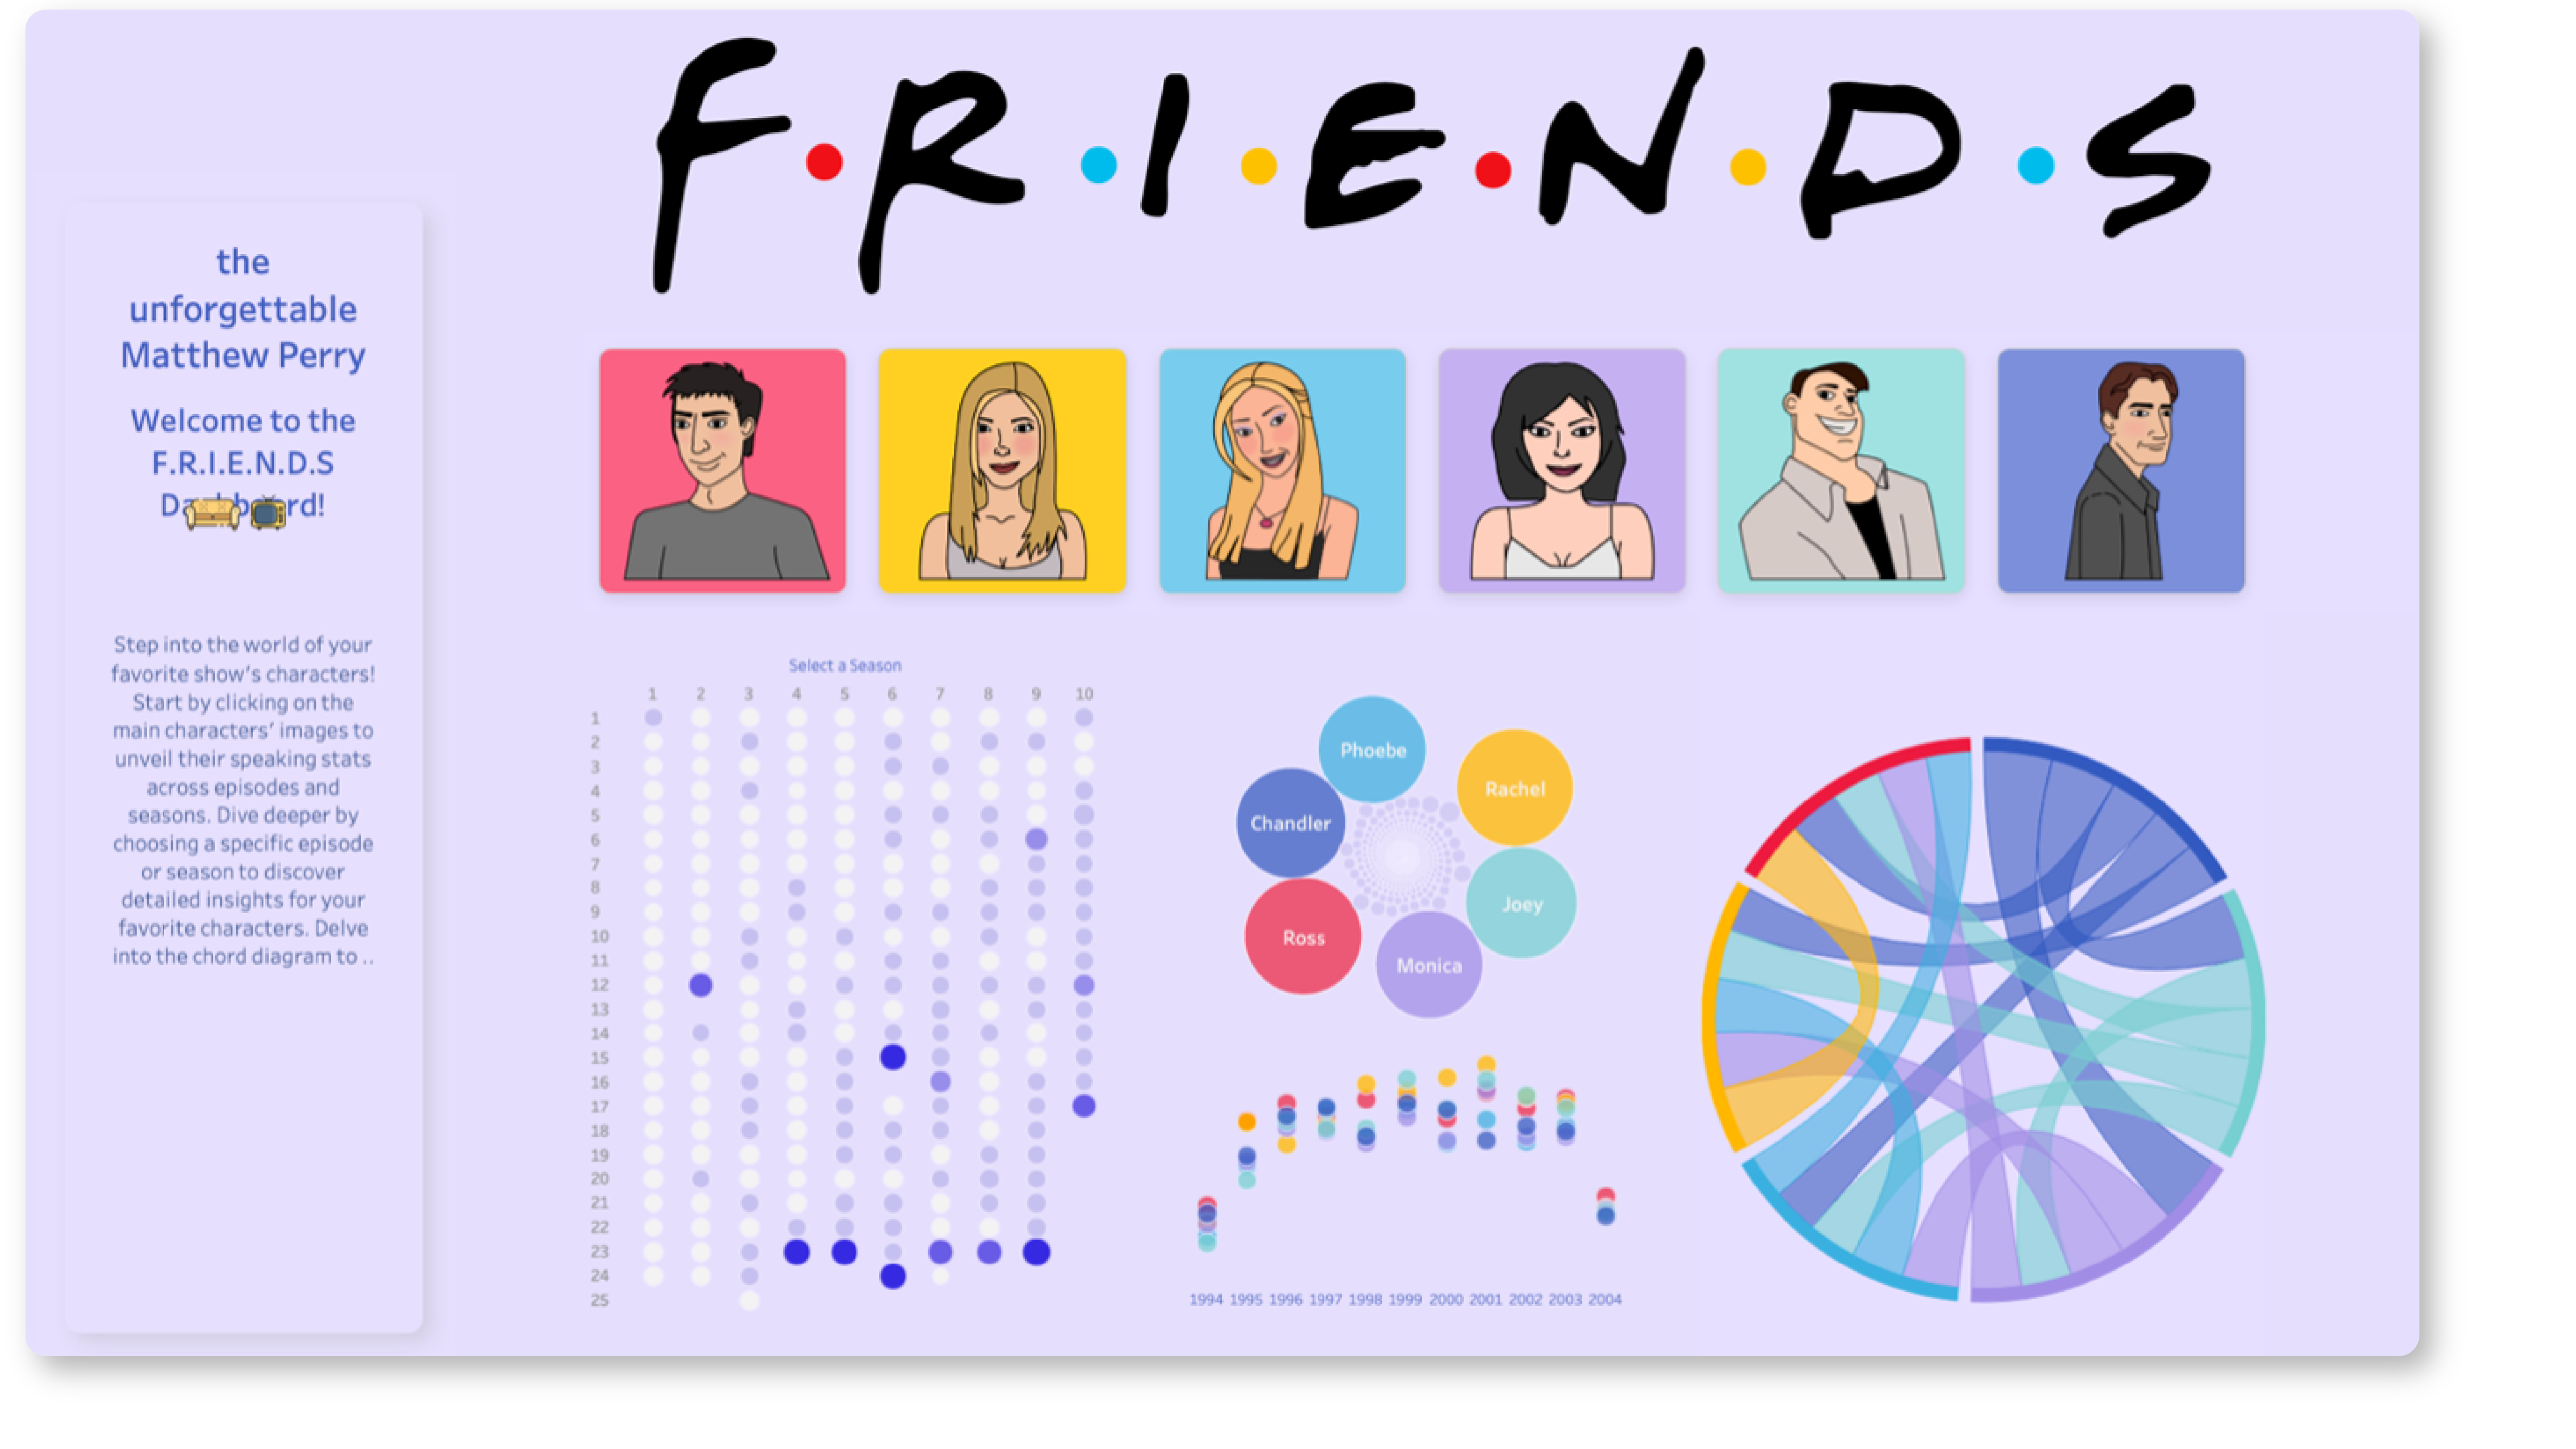
In tribute to the Unforgerrable Matthew Perry, welcome to the F.R.I.E.N.D.S Dashboard! Explore the F.R.I.E.N.D.S Dashboard for a nostalgic journey, and explore their speaking stats across episodes and seasons. Click on main characters' images to unveil personalized insights. Dive deeper by selecting a specific episode or season, revealing detailed information. Explore the chord diagram to see the frequency of character interactions in the chosen episode. Enjoy the journey with this interactive dashboard.
Improved decision-making
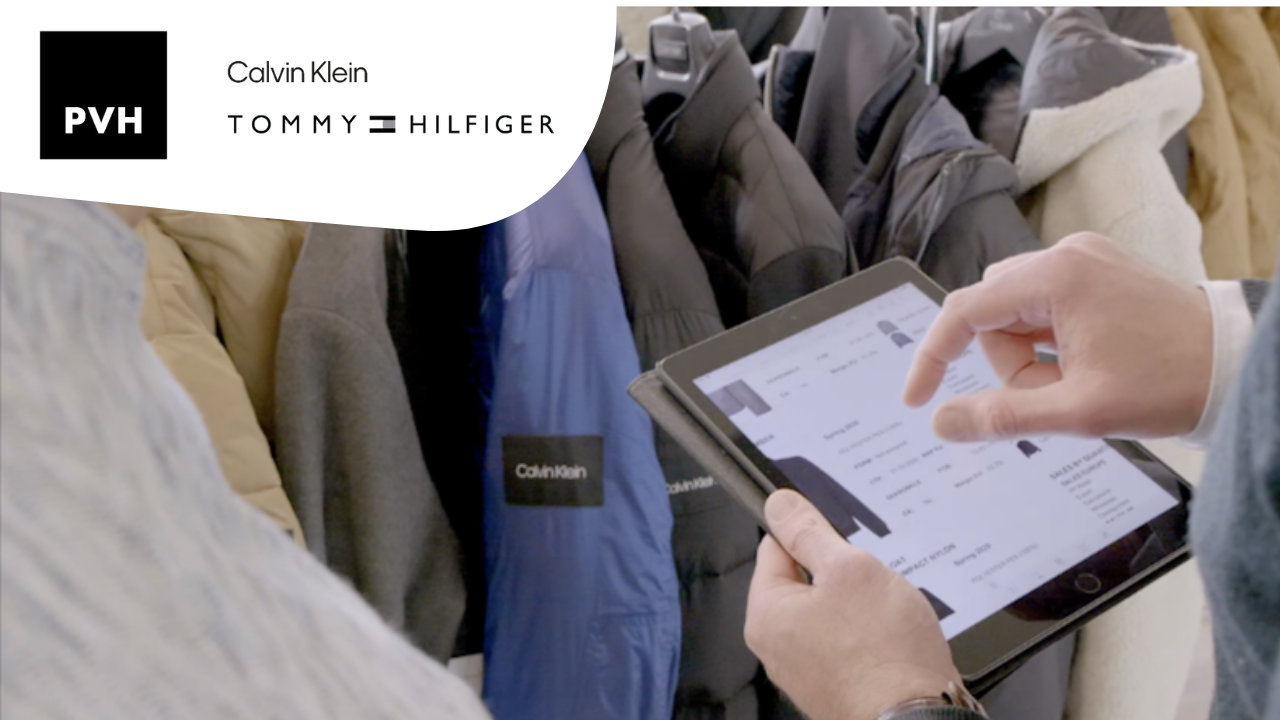
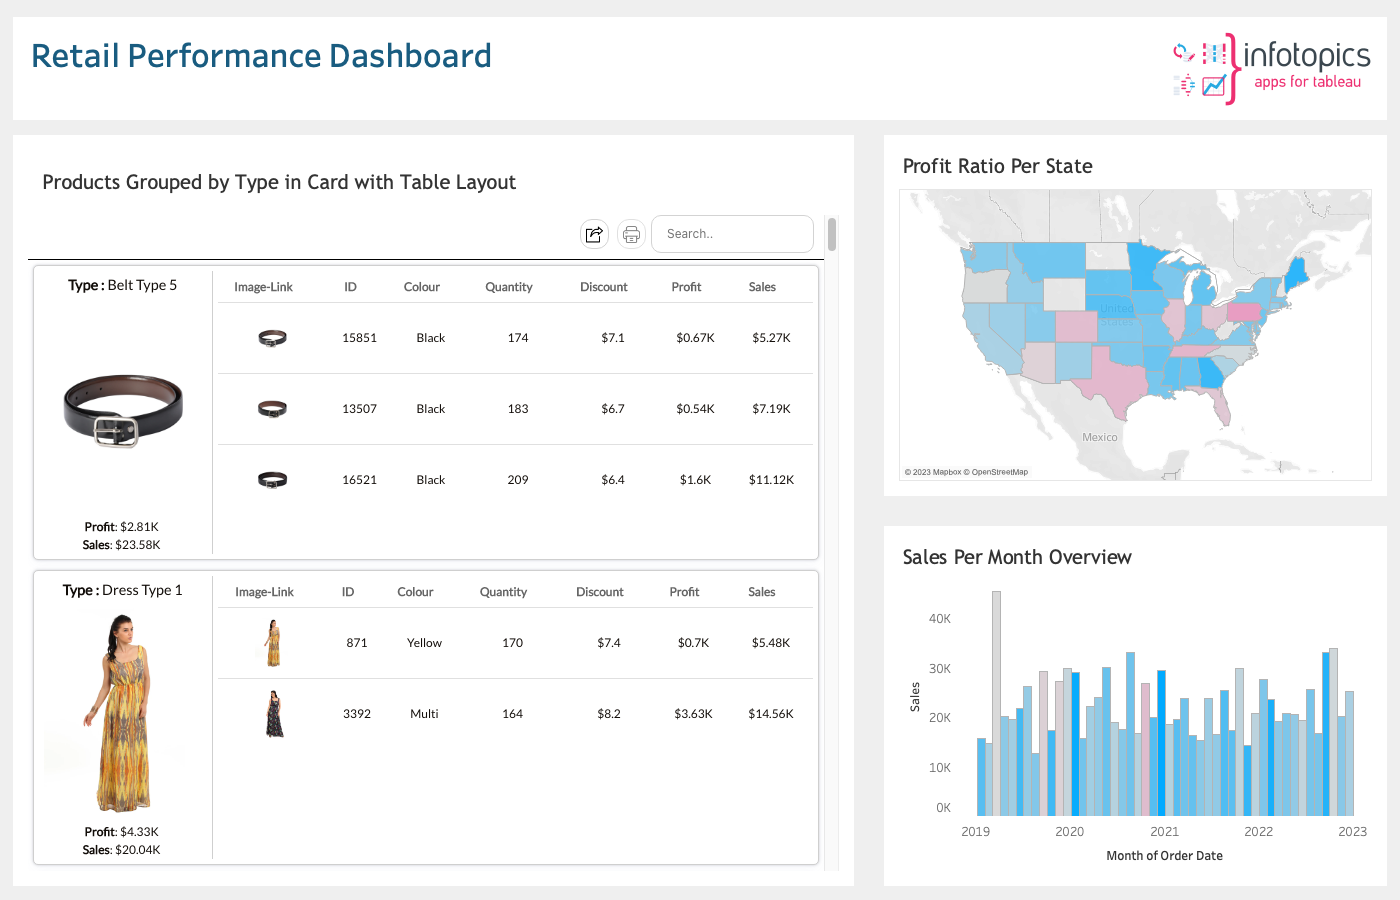
At PVH, the parent company of Tommy Hilfiger & Calvin Klein, teams are responsible for designing, developing, merchandising & selling thousands of new styles across seasons. Thanks to PictureThis, these teams can leverage high-resolution product imagery in combination with product performance metrics to analyze their collection. Decision-makers can easily sort through the retail data and determine the performance of each style which lead to enhanced data analytics.
Visualize products next to the data
PictureThis enables Carter’s to manage their inventory and merchandising by having real-time insights into the best-performing styles, which products are not performing that well, etc. Having these images embedded with the data gives the business users the right information at the right time to make important decisions quickly.
Efficient Analyzing
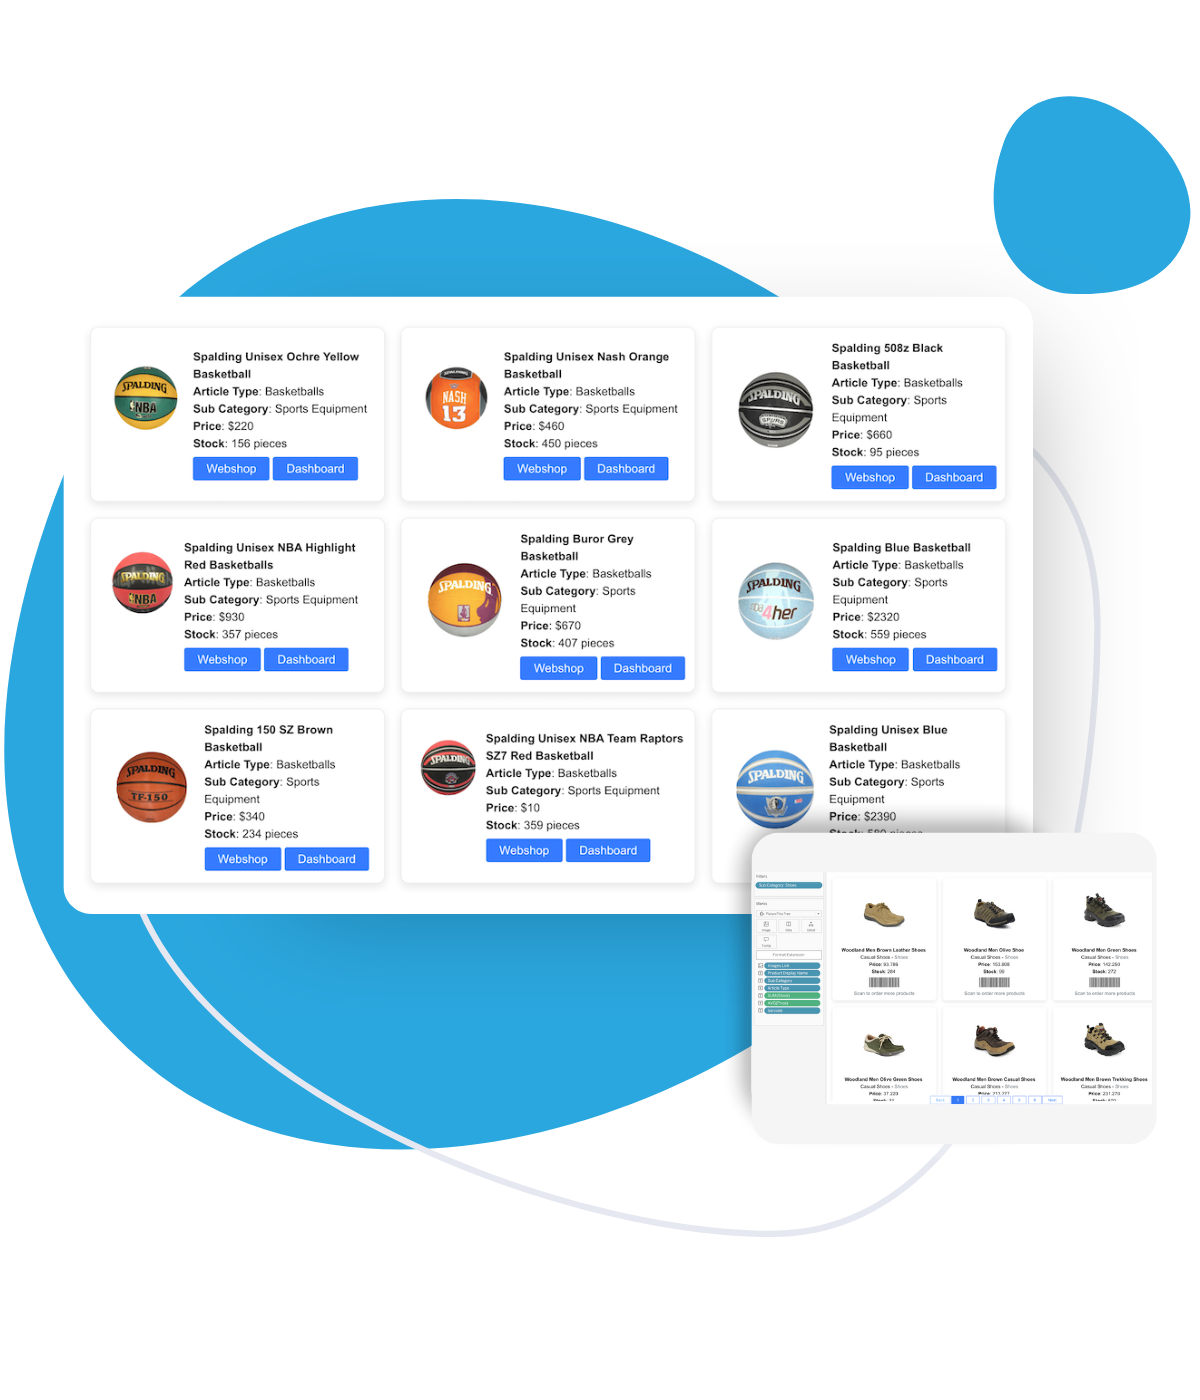
Display images in Tableau and enhance data analysis easily. Facilitate everyday reporting and have a valuable overview of all your products. Your team can effortlessly see which products they are discussing during everyday reporting and it is much easier to analyze data and take action with the images, as you can keep track of every product in the product ranges.
“We have legitimately had users get emotional (in a good way) after the launch of our PictureThis enabled dashboards due to the amount of time saved & confidence they have in using these overviews to understand & make better decisions for our collections.”

Download the FREE whitepaper.
Learn how to supercharge your Tableau Dashboards with PictureThis.

Revolutionize your data with trusted partners.
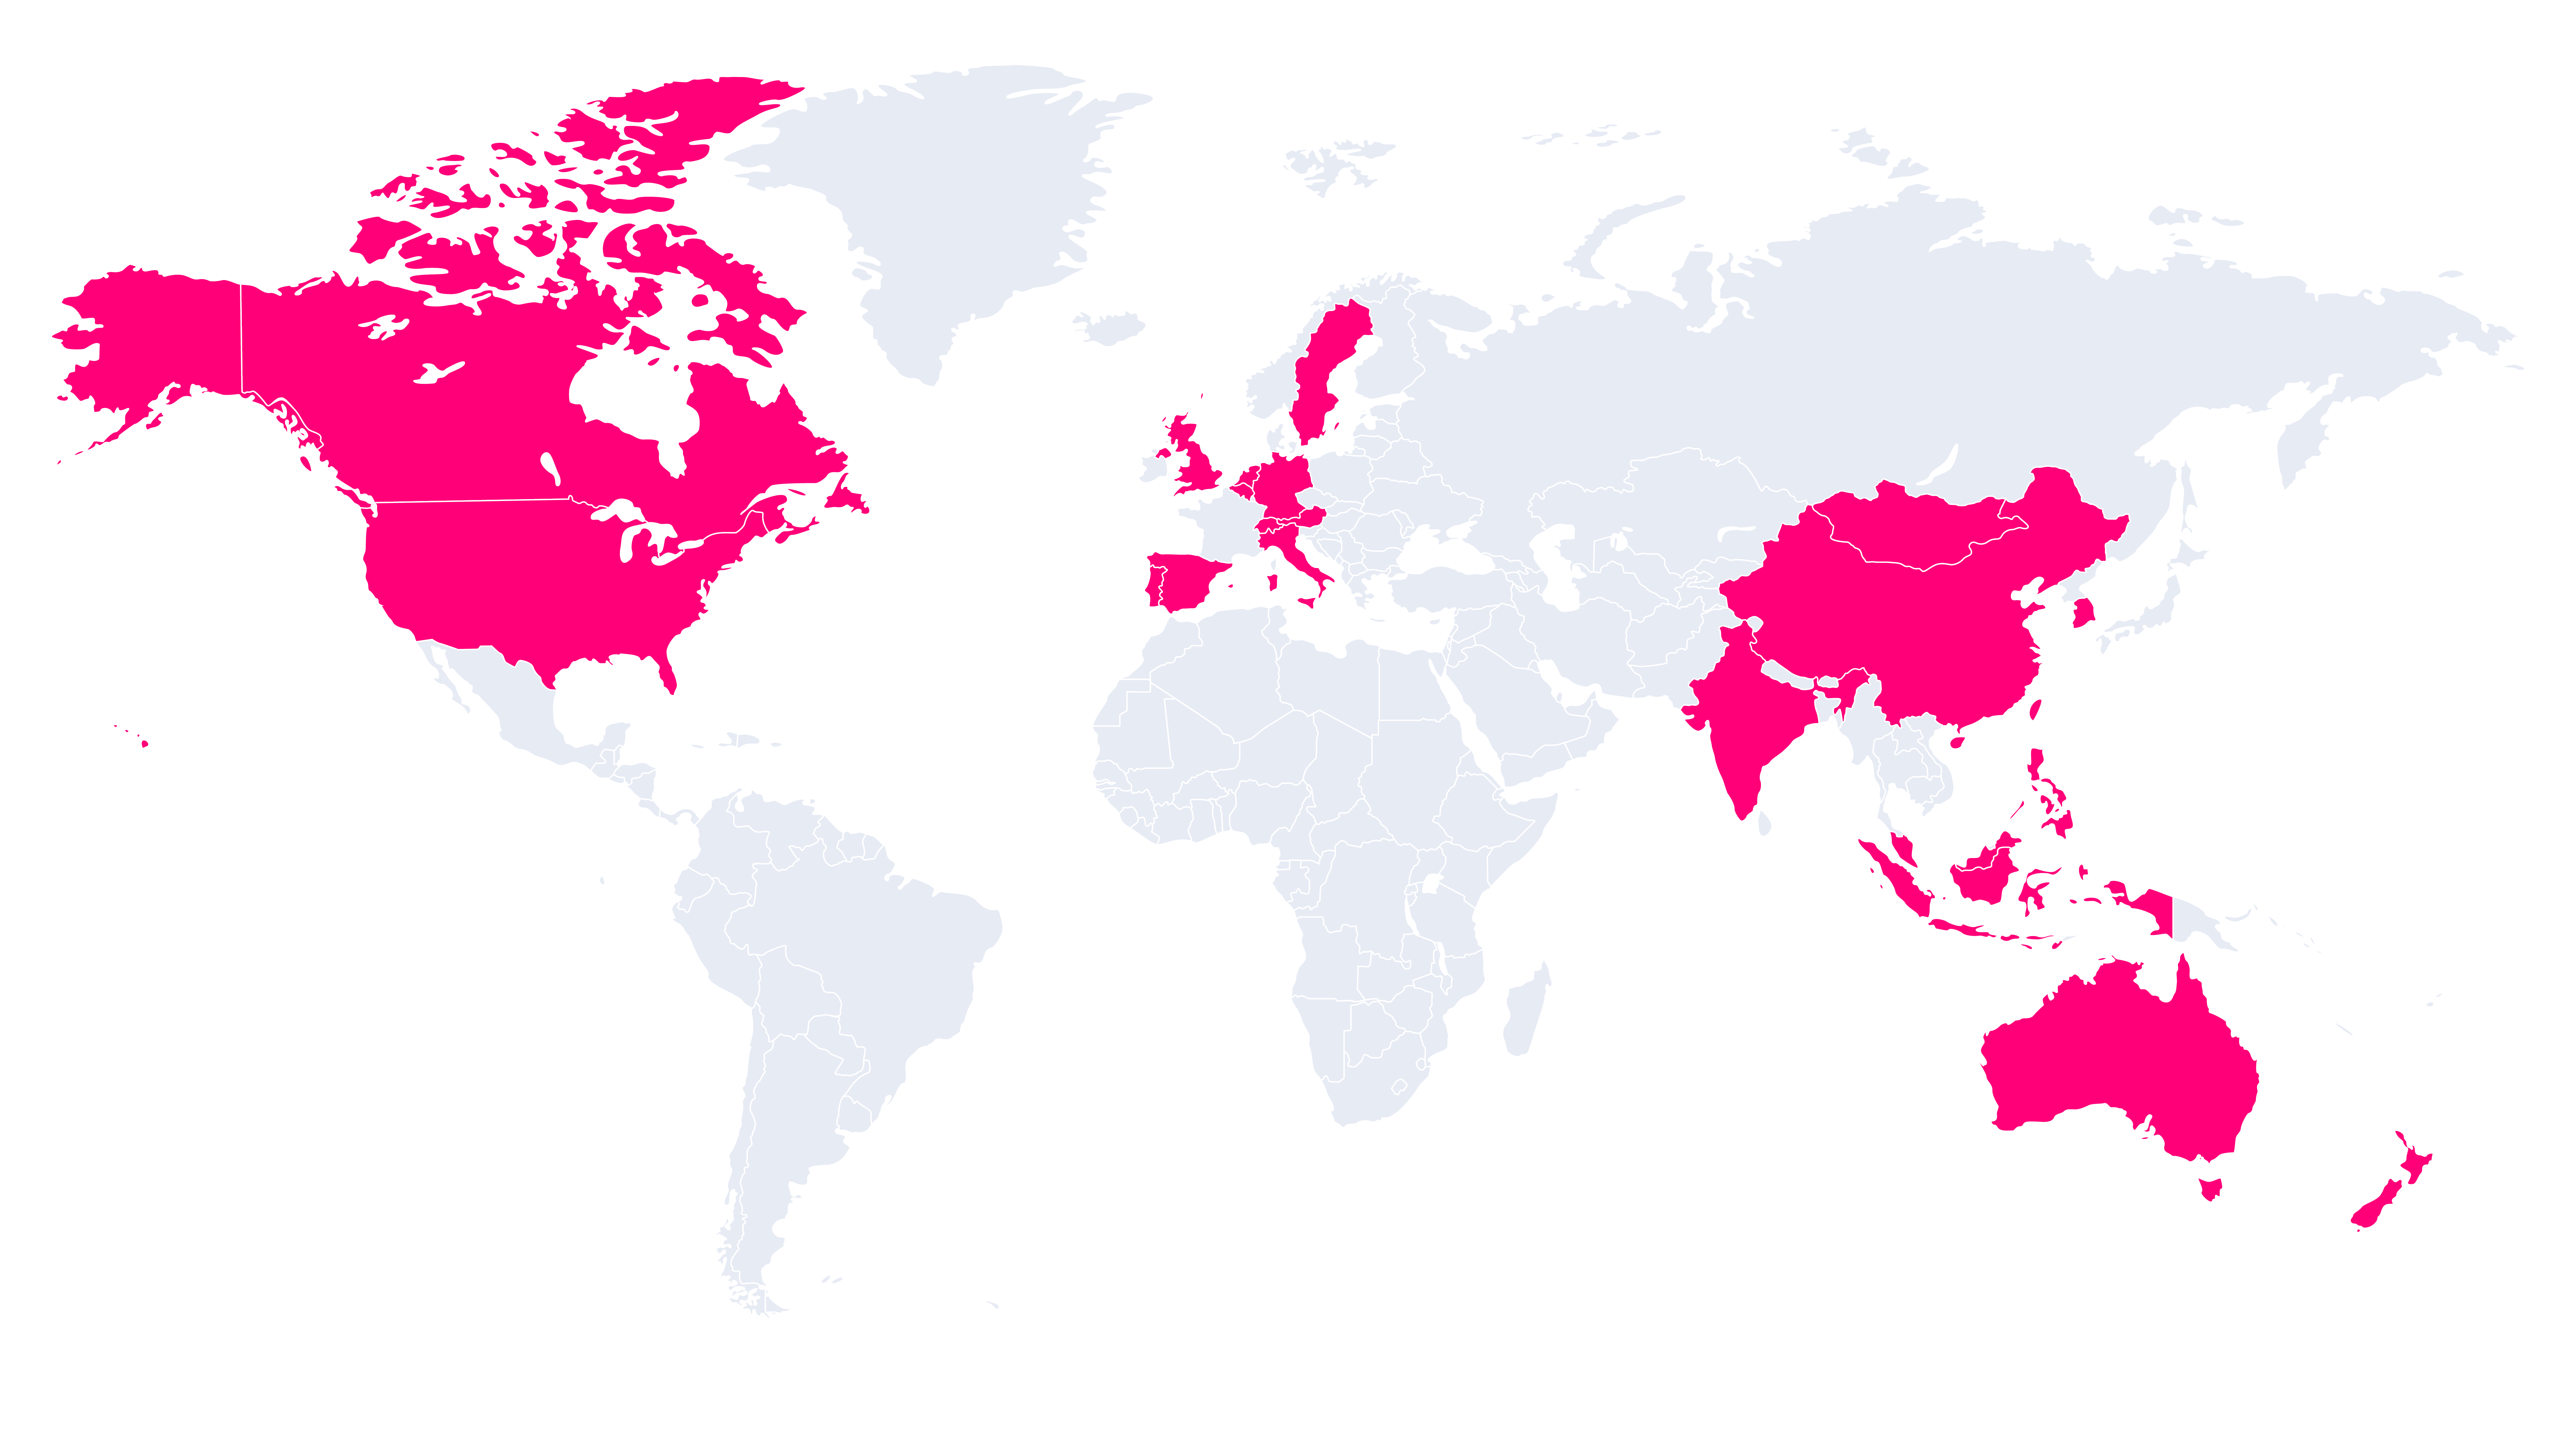
The Apps for Tableau partner network is a trusted and experienced team of consulting and reseller partners, dedicated to serving professionals worldwide in their native language.
Discover how PictureThis can revolutionize the way you handle data, enabling you to make better-informed decisions and achieve remarkable outcomes in your industry. Locate one of our trustworthy partners and start optimizing your data-driven journey.
FAQ
Yes! Apps for Tableau has officially achieved ISO/IEC 27001:2022 certification.
You can find the information about our data security here.
Yes, you can request more information by filling in the form on the pricing page.
Yes, you can request more information by filling in the form on the pricing page.

