ProcessMining
with amazing features
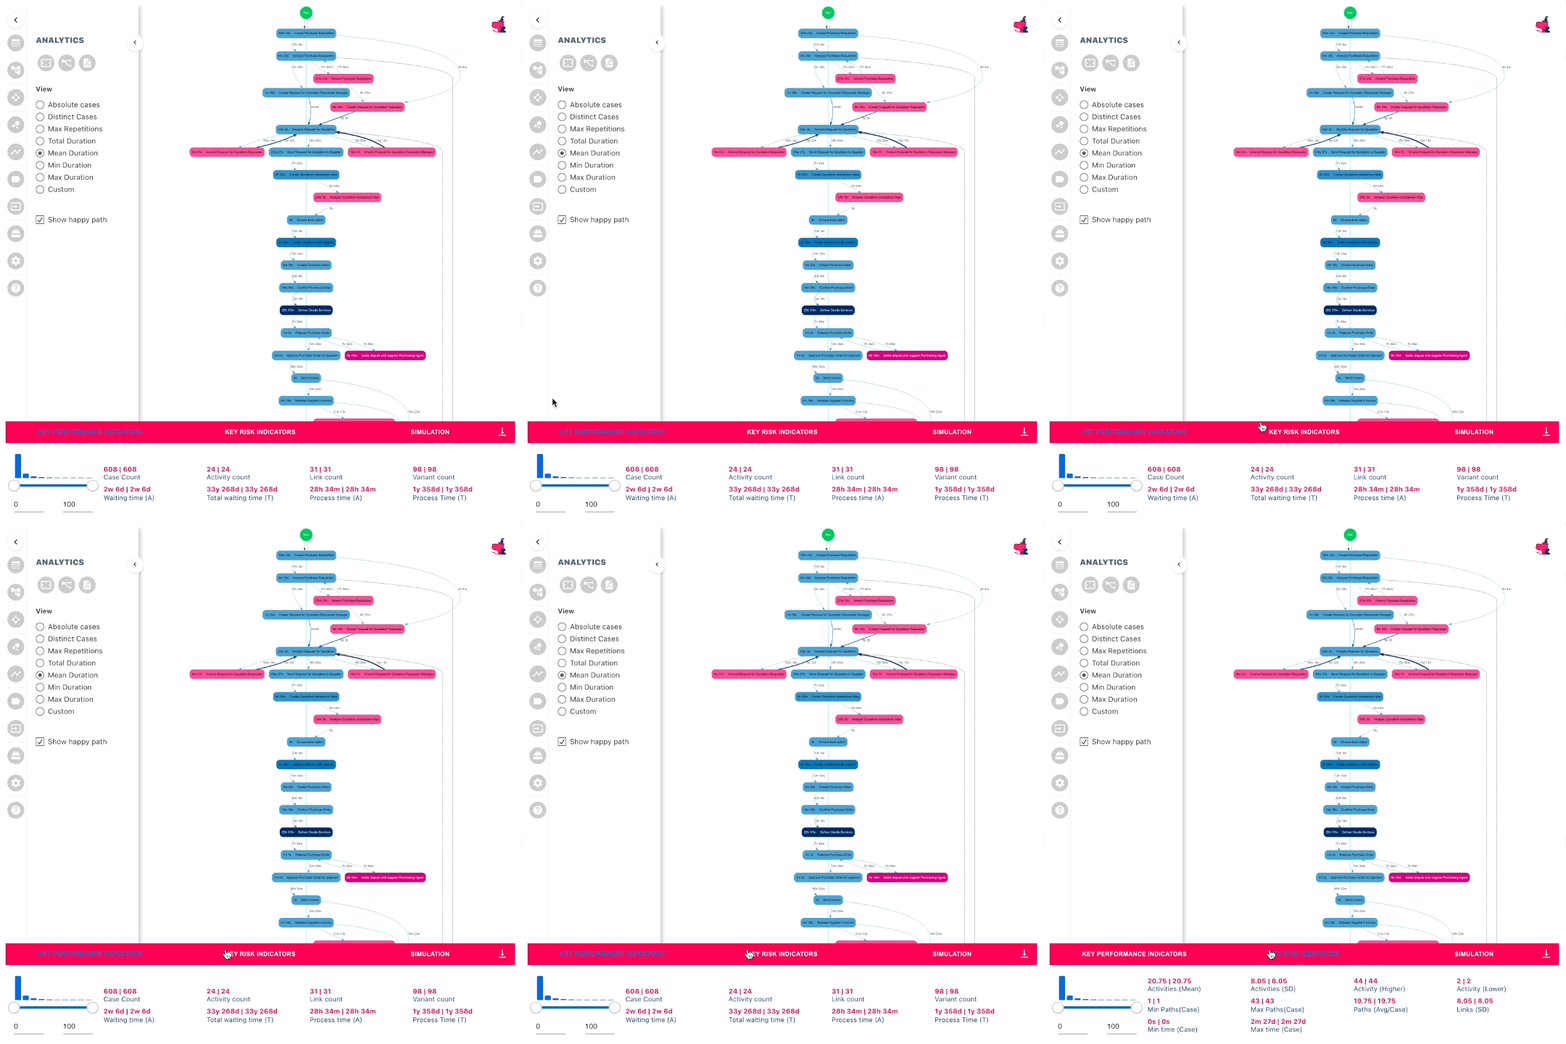
KPI Bar
KPIs are like scorecards that tell you how well your process is doing. They show if your process is meeting its goals. By keeping an eye on these scorecards, you can figure out where things might be going wrong and make improvements. By paying attention to these numbers, you can figure out where your process might need improvement.
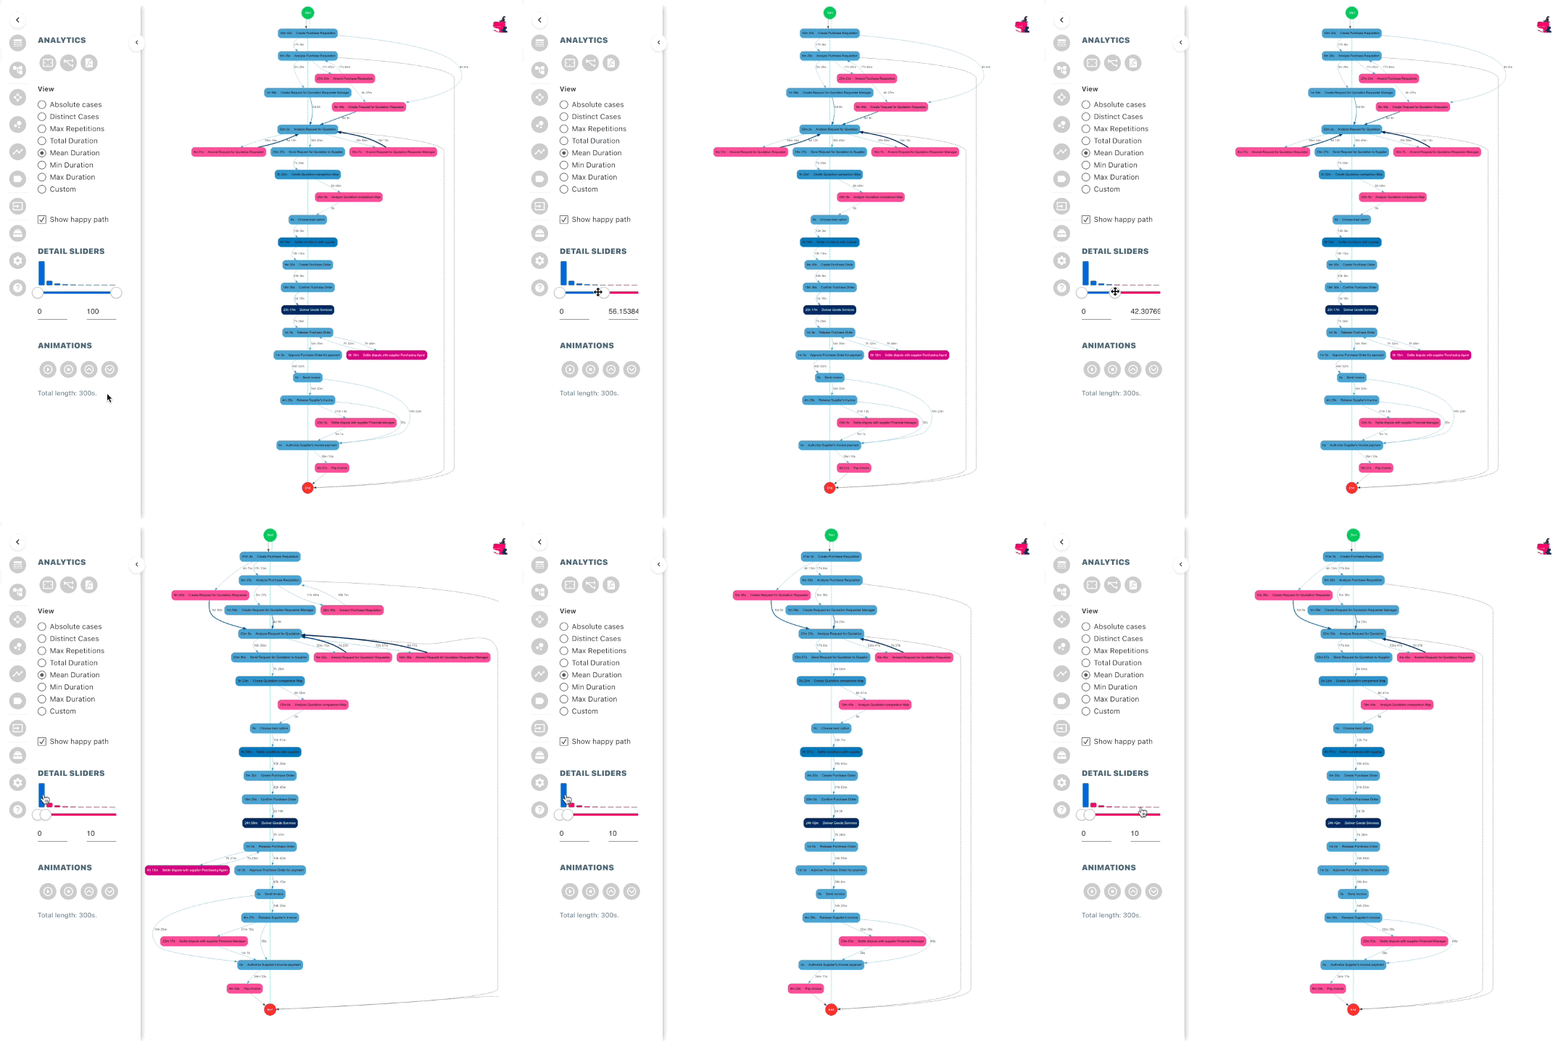
Detail Slider (variants)
The Detail Slider enables you to look at different ways things can happen in your process. Imagine looking at a map of all the routes people take to work. The Detail Slider helps you focus on just the main highways or the less-traveled roads, depending on what you want to see. It’s like zooming in on the roads that matter most.
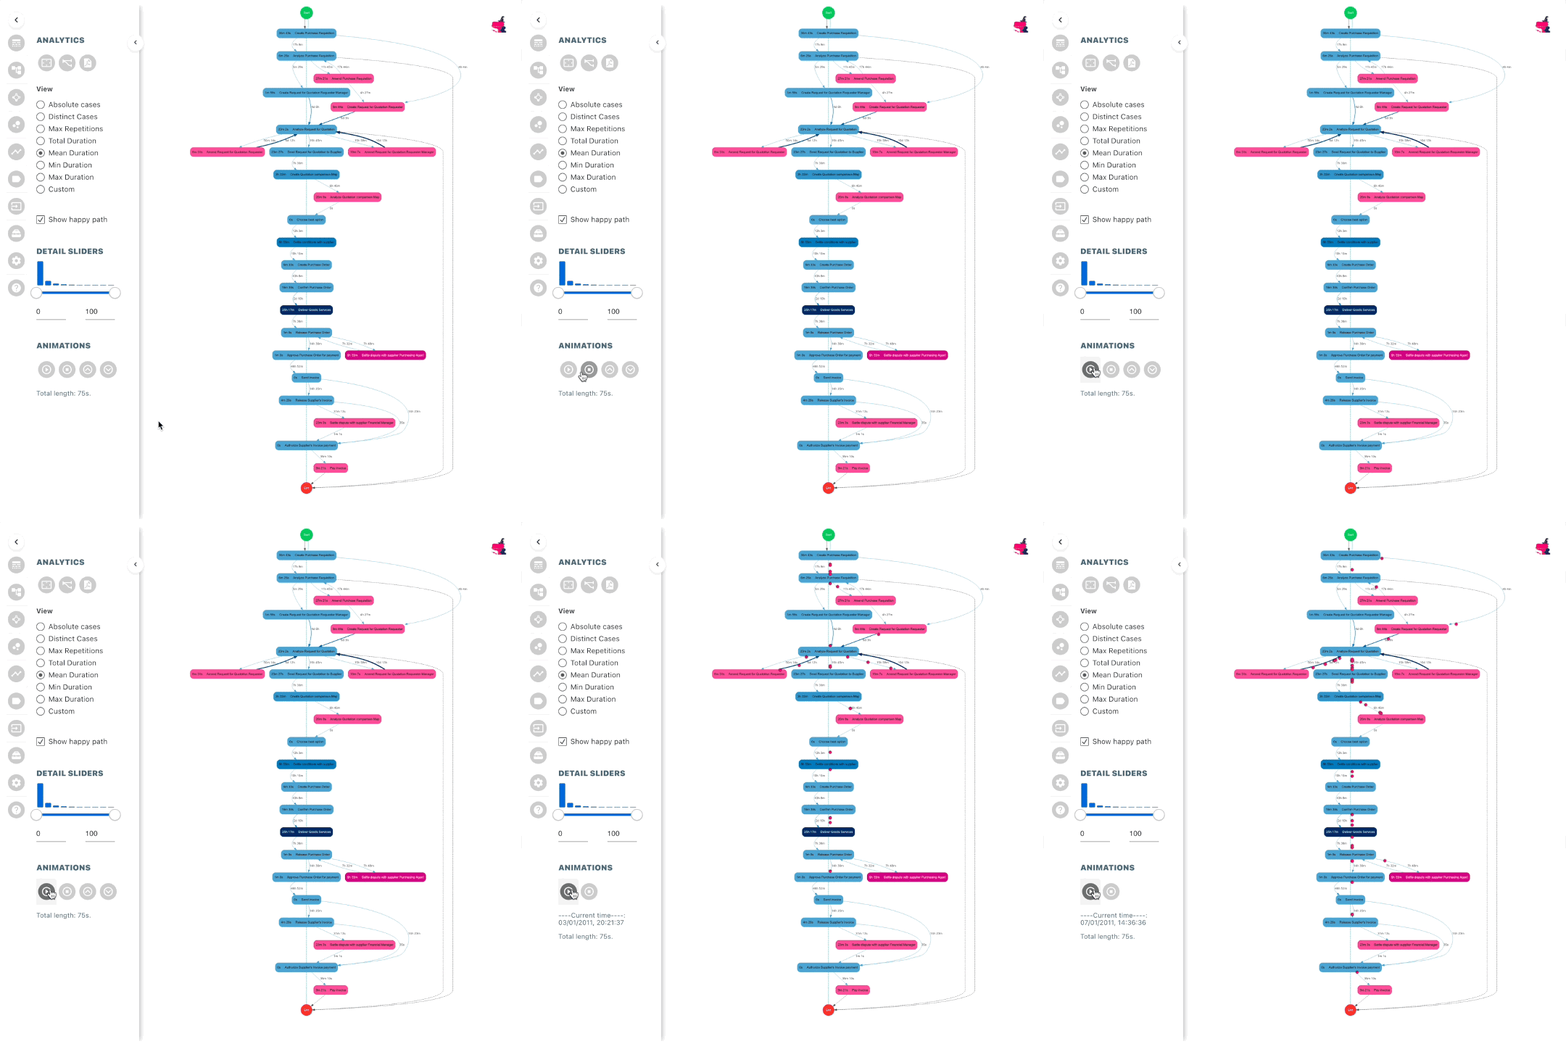
Animations
Picture a little show on your process map where tiny dots move along the path. These dots represent real cases moving through your process. The size and speed of these dots can tell you where things might be slowing down, kind of like seeing where cars get stuck in a traffic jam. It helps you spot the bottlenecks in your processes.
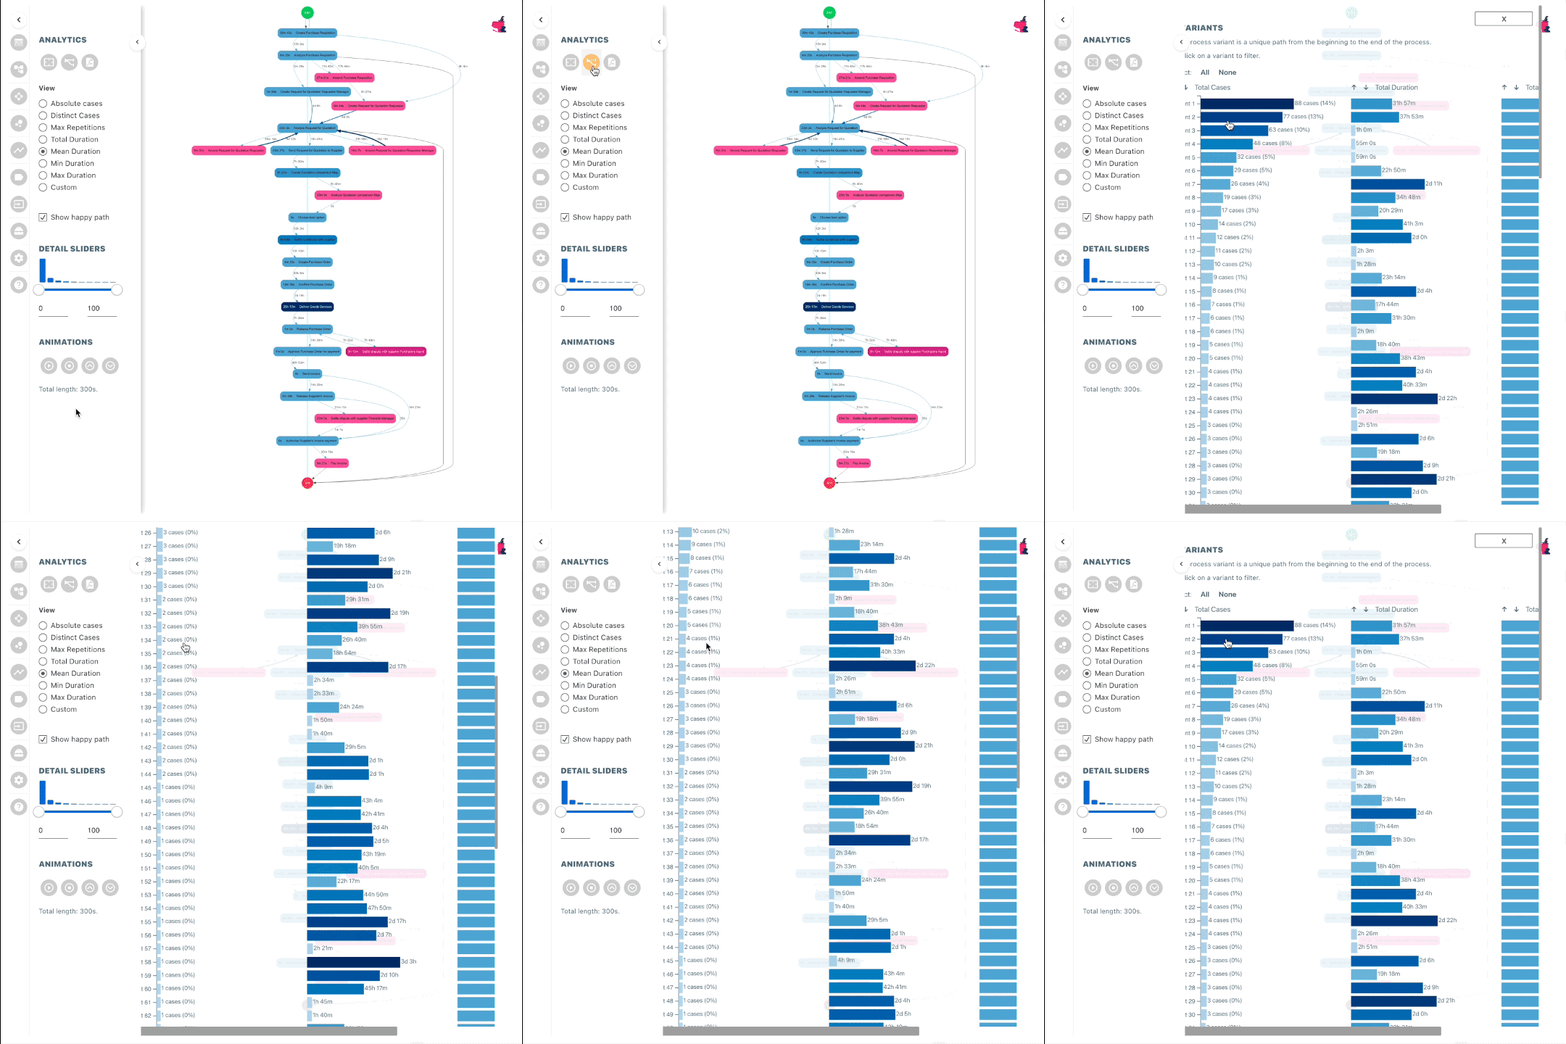
Variant Analysis
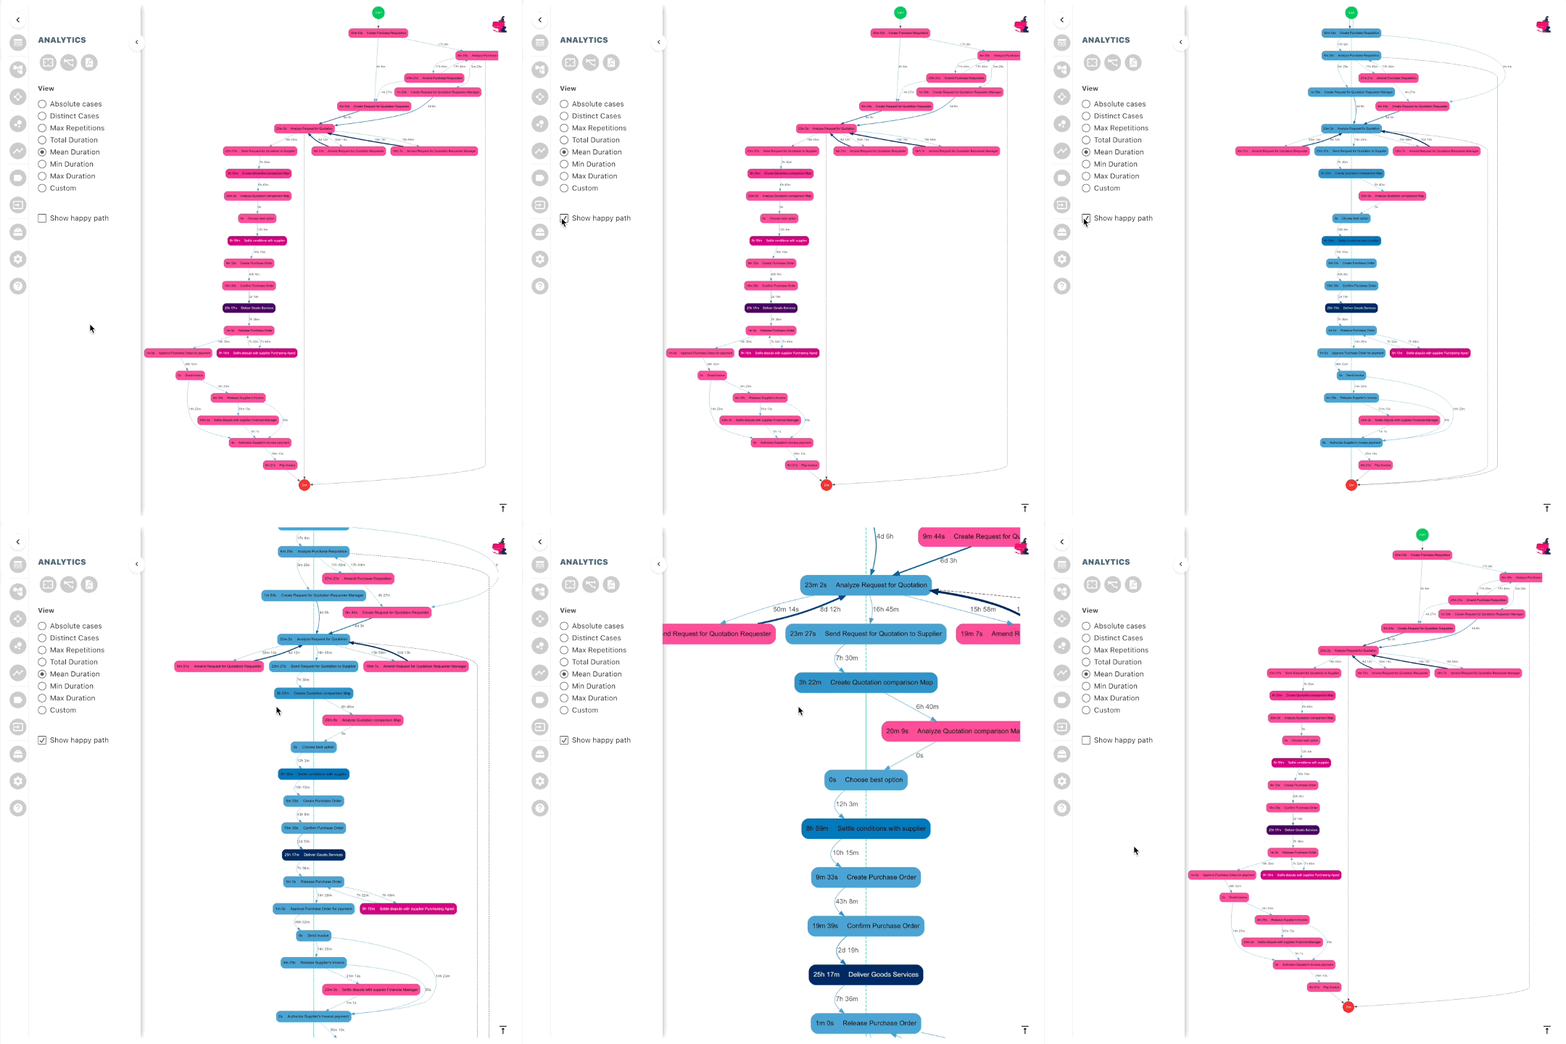
Help your organization work more efficiently by understanding how different ways of doing things in your process stack up. The Variant Analysis helps you see different ways your processes can happen and ranks them by how often they happen, so you can tell which ones are normal and which are unusual.
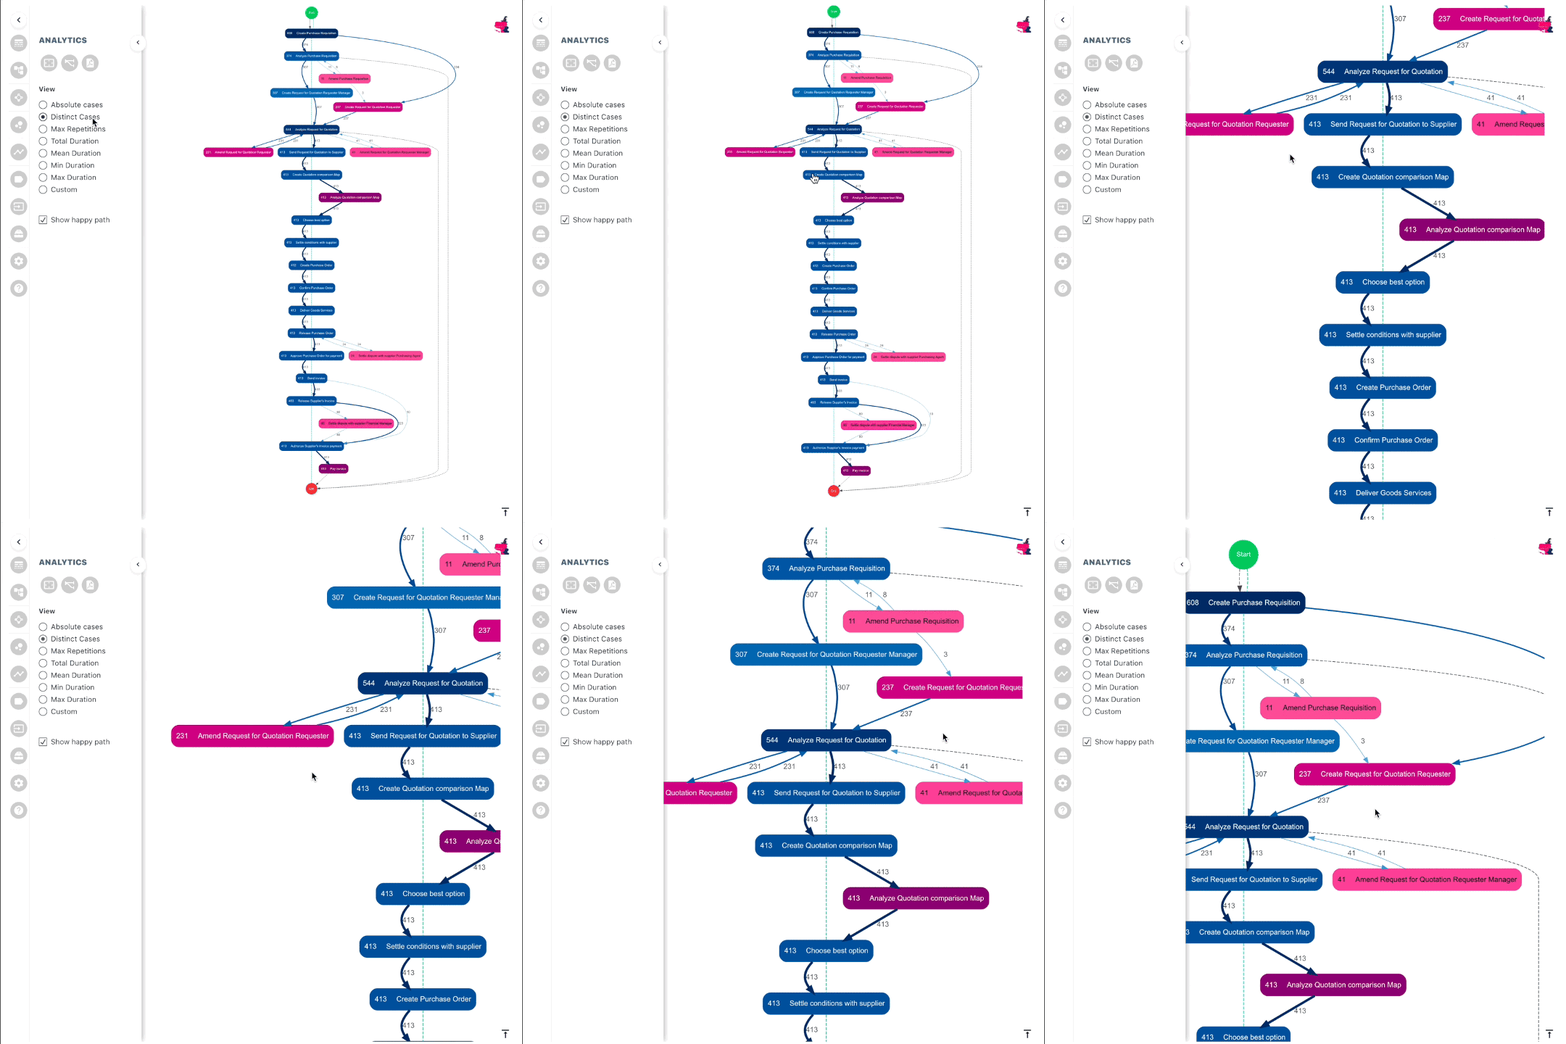
KPI Switch
Look at your process from different angles, and change what you want to see on the labels in your process map. It’s like having a switch to show different kinds of information like how long it takes for specific cases to move through the process, the average time, or other custom measurements based on your data.
Key Features

FAQ
Yes! Apps for Tableau has officially achieved ISO/IEC 27001:2022 certification.
You can find the information about our data security here.
Yes, the Detail Slider empowers you to initiate actions from Variants, Activities, and Paths within your process map. This dynamic feature enables you to zoom in on specific variants, delve deeper into activities, or explore different process paths, providing a more tailored and interactive experience to help you make informed decisions.
Animations add a dynamic element to your process map, visually simulating cases moving through activities. They help you understand waiting times, highlight bottlenecks, and provide a more interactive view of your process flow, aiding in process optimization.
You can configure a “Happy Path” in Process Mining as an ideal route for your processes. It’s essential because it helps you quickly identify when processes deviate from your preferred path, signaling potential issues that require attention and correction.
The KPI Bar provides a summary of key performance indicators (KPIs) in a visual format, while KPI Switch (Kip’s) allows you to dynamically switch between KPIs displayed in the process map node labels, enabling advanced analysis based on your preferences.
Variants Analysis helps identify different ways processes can occur and ranks them by frequency. It highlights mainstream processes and outliers, enabling you to streamline operations and eliminate bottlenecks for better efficiency.
You only need basic data, including a unique case ID and the activities involved in your process. While optional, you can also include timestamps (date and time) for the start and end of each activity for more detailed analysis.
Of course! Our products thrive on customer feedback, feel free to contact us with your feature requests.
