Trusted.
By 600+ companies in 150+ countries.
Use Excel-like features without leaving Tableau
With the SuperTables Extension for Tableau and Power BI, you can offer your dashboard users the power of interactive and dynamic Excel-like tables. Enable users to decide how to organize and analyze their data in a flexible grid using features just like in Excel without leaving Tableau. Enrich your dashboards with SuperTables and allow your users to do their own analysis with the summarized data of your visualizations.
Countless features for your use case.

“I have over a thousand users on Tableau, and we are still growing at a rapid pace. SuperTables has made Tableau so much more accessible to people that are used to Excel and have raised their game for how they think about data and analytics at our company. Because it’s so easy to use, even savvy business users are able to incorporate it in a matter of minutes.”
– Krystin Kim, Sr. Director, Decision Science at Postholdings
“I have over a thousand users on Tableau, and we are still growing at a rapid pace. SuperTables has made Tableau so much more accessible to people that are used to Excel and have raised their game for how they think about data and analytics at our company. Because it’s so easy to use, even savvy business users are able to incorporate it in a matter of minutes.”
– Krystin Kim, Sr. Director, Decision Science at Post Holdings
Better Together.
Learn from real-life use cases.
See it in action with pre-built solutions.
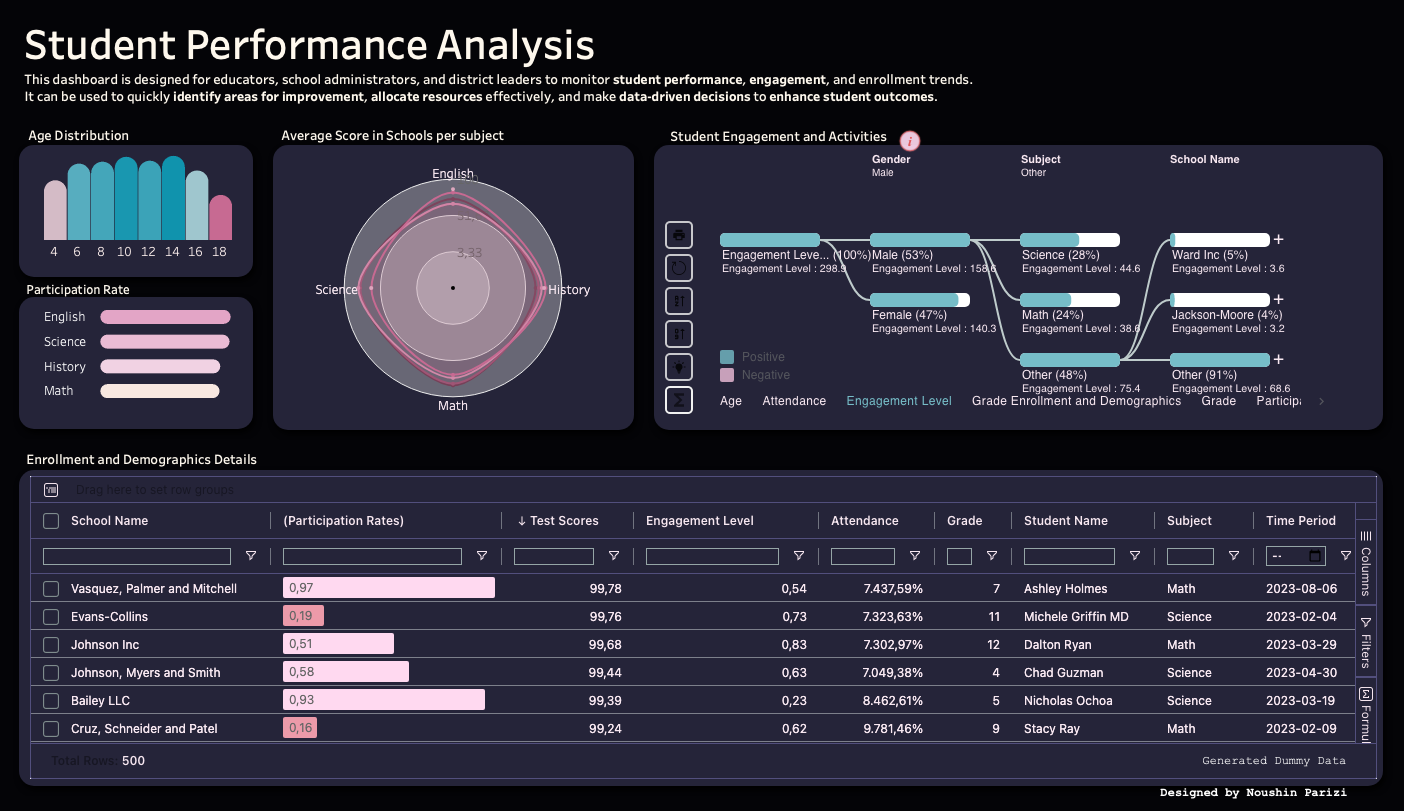
Discover the power of insights with our interactive dashboard! Designed for educators and school leaders, this solution helps you visualise key trends in student engagement, participation, and scores across subjects. Easily spot areas for improvement and make data-driven decisions to boost student outcomes. Download now and see how it can elevate your education strategy.
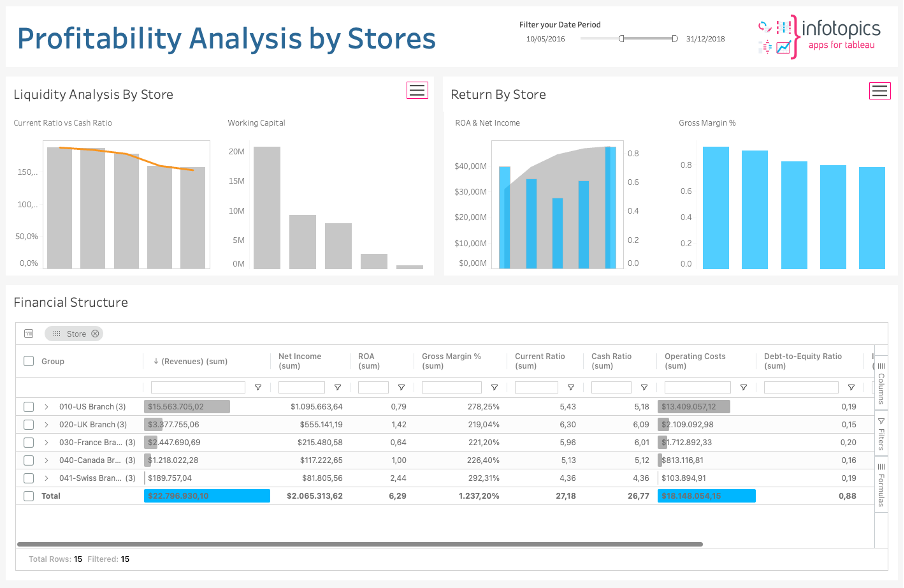
This solution for financial statements offers dynamic dashboards for real-time monitoring, strategic resource allocation, and scenario modelling. Easily explore “What-If” scenarios, monitor financial health in real-time, and optimize resource allocation game-changing capabilities in SuperTables. Use the ShowMeMore Waterfall Chart to model various financial scenarios, from cost reductions to market expansions, making informed choices. Uncover opportunities and address risks with this solution.
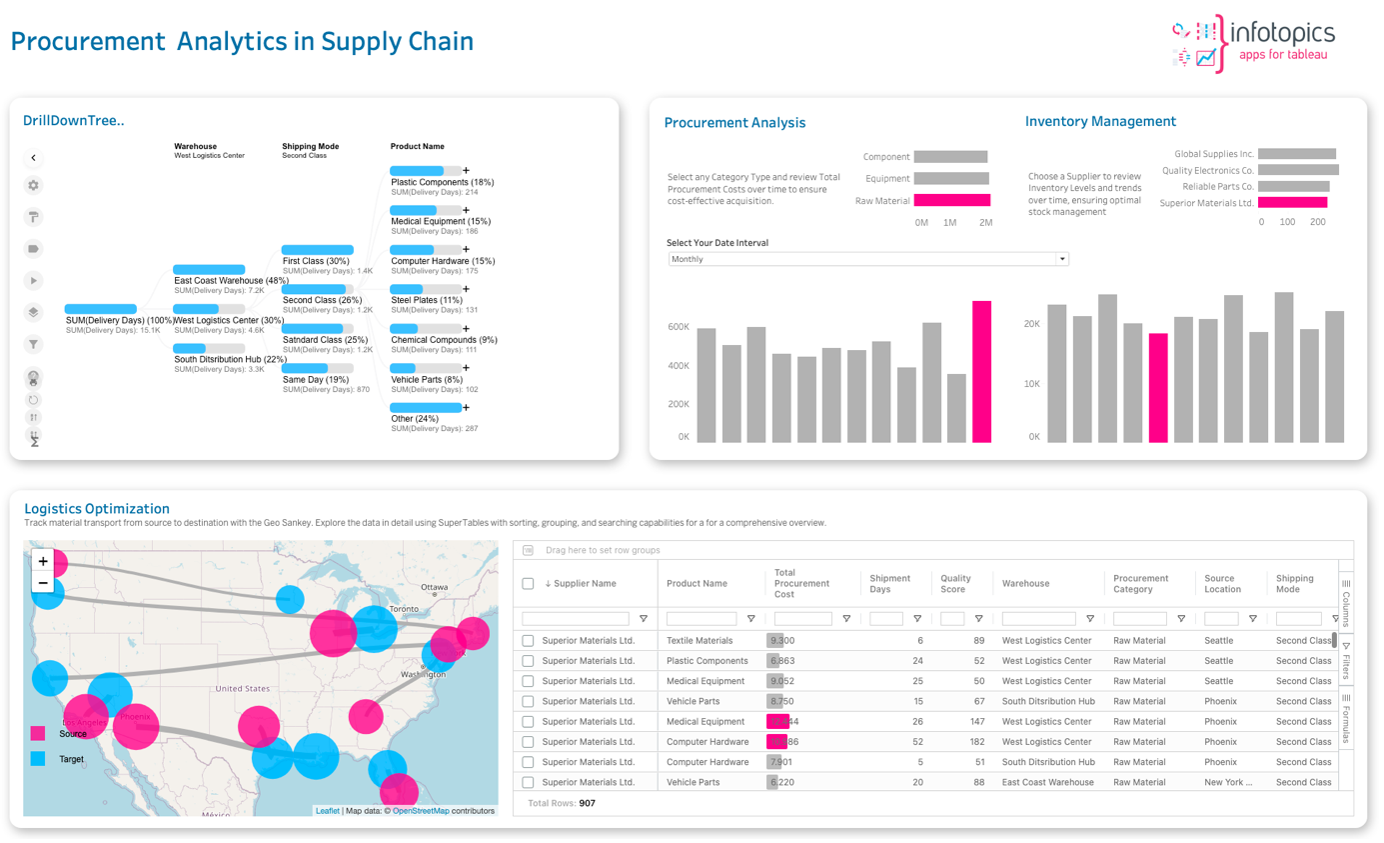
Explore this solution to simplify the complexities of supply chain management. Whether you're in manufacturing or logistics, this dashboard is tailored for you. With an intuitive overview and DrillDownTree, it offers insights into your entire supply chain. The Performance Metrics Dashboard tracks key metrics, and Geo Sankey visualizes material flow for optimized transportation routes. SuperTables at the bottom right create a user-friendly space for easy exploration, streamlined logistics, enhanced category-based performance, and informed decision-making. This dashboard, powered by extensions, adds immense value by providing insights for a seamless supply chain operation.
“Now, users don’t have to go back to either the BI or my team and ask us to build specific tables for their needs. They have the flexibility to do it themselves with SuperTables.”
– Selma Dogic, Data & Analytics at Carter’s

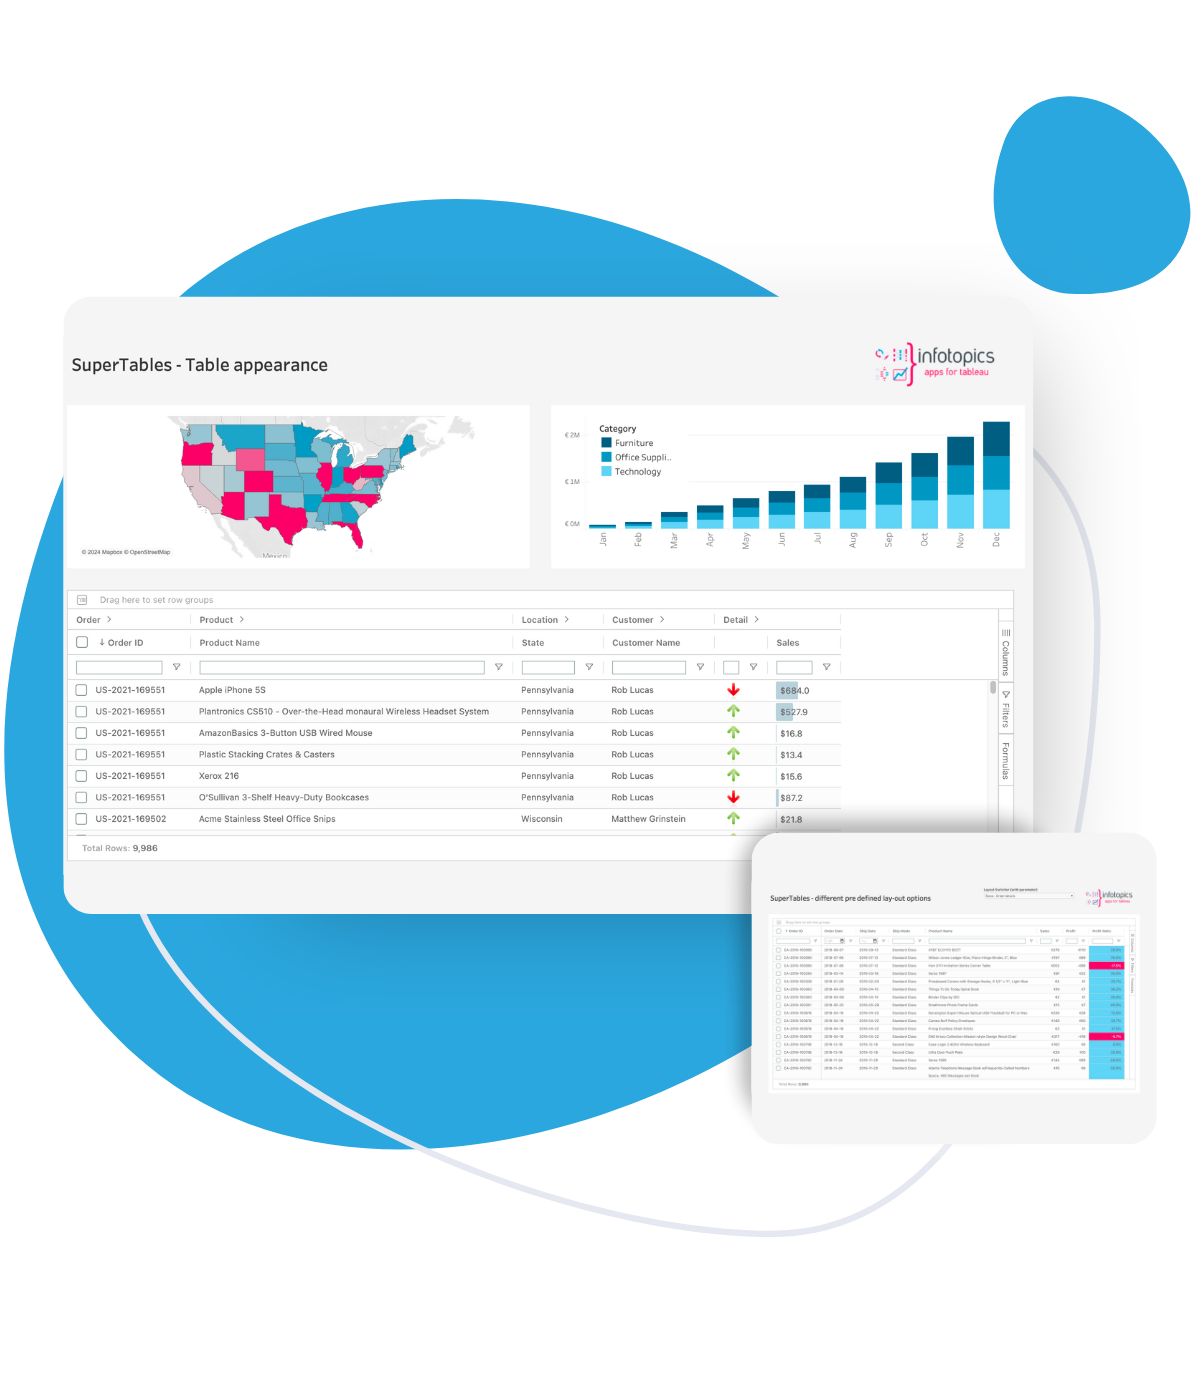
Download the FREE whitepaper.
Learn how to supercharge your Tableau Dashboards with SuperTables.

Revolutionize your data with trusted partners.
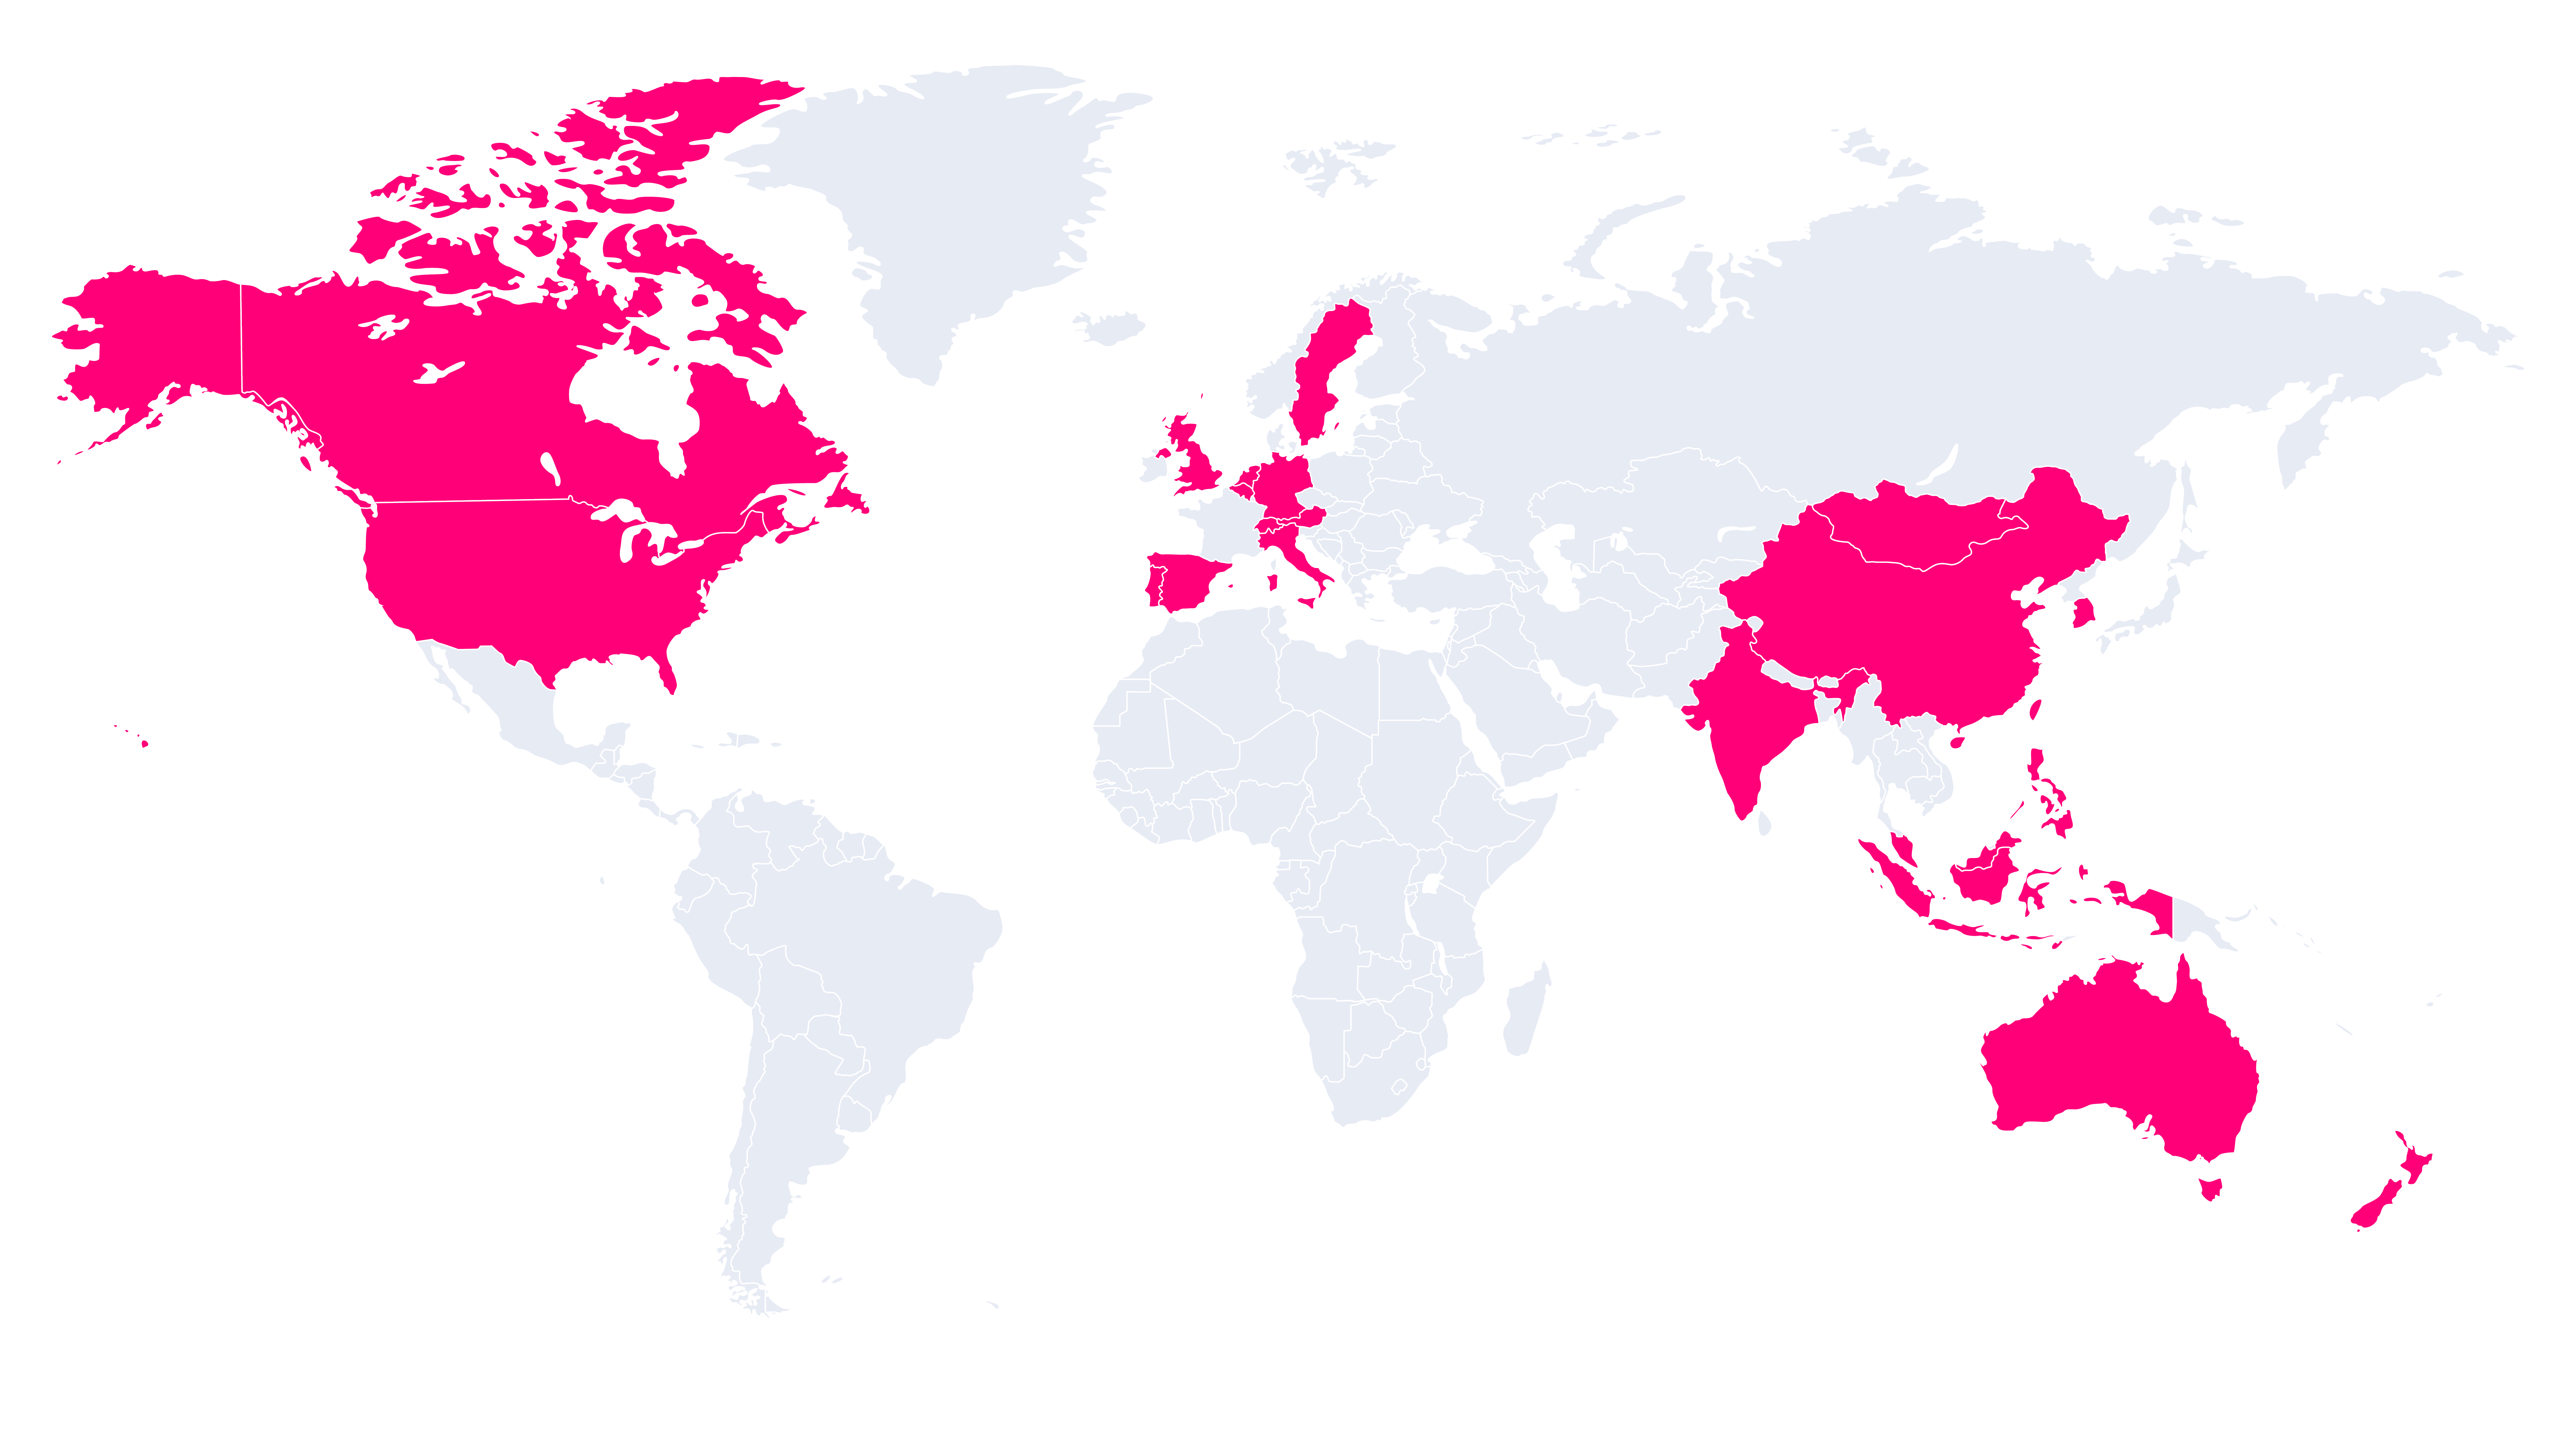
The Apps for Tableau partner network is a trusted and experienced team of consulting and reseller partners, dedicated to serving professionals worldwide in their native language.
Discover how SuperTables can revolutionize the way you handle data, enabling you to make better-informed decisions and achieve remarkable outcomes in your industry. Locate one of our trustworthy partners and start optimizing your data-driven journey.
FAQ
Yes, you can request more information on the pricing page.
Yes, you can request more information by filling in the form on the pricing page.


