
Trusted.
By 600+ companies in 150+ countries.


Learn from a real-life use case.

Akamai’s cost-cutting solution transformed their Tableau analytics.
Akamai’s Services team needed flexible data exploration for a large Tableau audience without hundreds of filters, so they implemented DrillDownTree to build next-level dashboards.
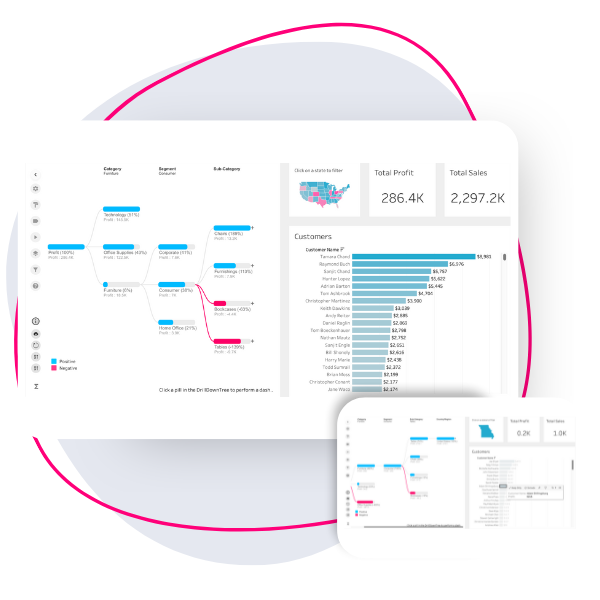
The heart of actionable insights.
Dashboards are designed to guide users toward actions that improve organizational performance. DrillDownTree helps teams get faster answers from their data by letting users explore dashboards from different angles and move from an overview to a detailed view within the same dataset. This approach raises the right questions, supports smarter decisions, and saves time on analysis, making it an ideal tool for ad hoc and root cause analysis while driving real business results.
Countless features for your use case.

“The DrillDownTree Extension enables our organization to slice and dice data depending on the audience: from management looking at geo-level trends to account teams working to improve their account operations, the DrillDownTree has helped us achieve faster & more flexible analysis and results.”
How and why root-cause-analysis can help your business.
Identifying the root cause of problems or issues in business is a critical skill for any successful business. By taking the time to ask the right questions and digging deep into the issue, you can get to the heart of the problem and develop solutions that will bring positive change to the business. Explore the advantages of utilizing root cause analysis in Tableau dashboards and learn when, why, and how businesses can implement it.
Let us help you get started.
Support
Our team is committed to your success with Infotopics | Apps for TableauContact us by mail:

FAQ
Yes! Apps for Tableau has officially achieved ISO/IEC 27001:2022 certification.
You can find the information about our data security here.
Yes, you can request more information by filling in the form on the pricing page.
Yes, you can request more information by filling in the form on the pricing page.