ShowMeMore
Create beautiful new visuals in Tableau with just a few clicks.
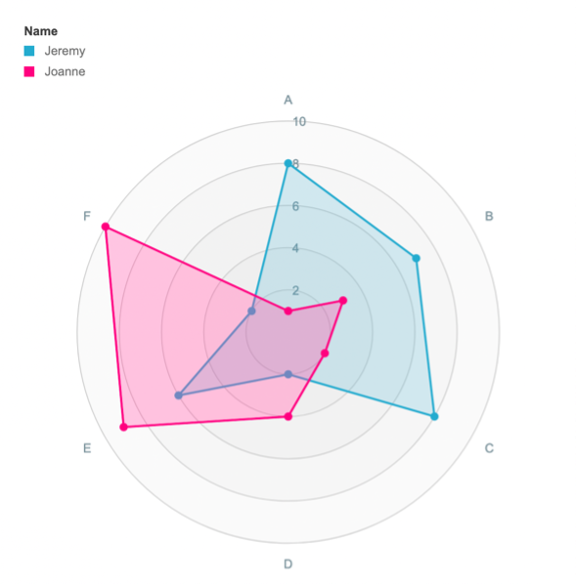
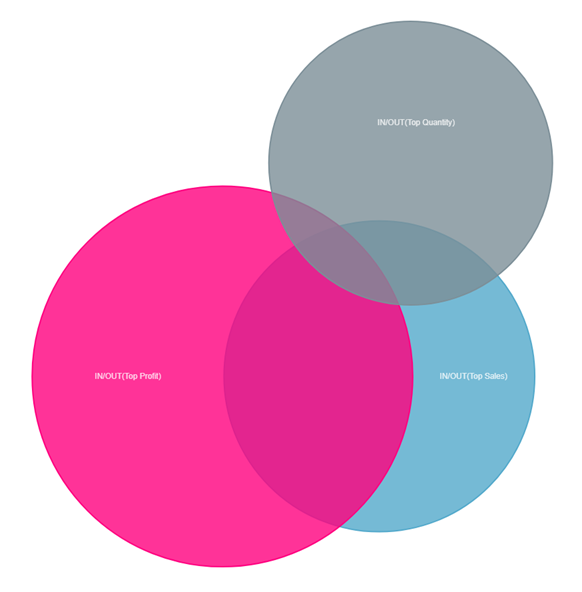
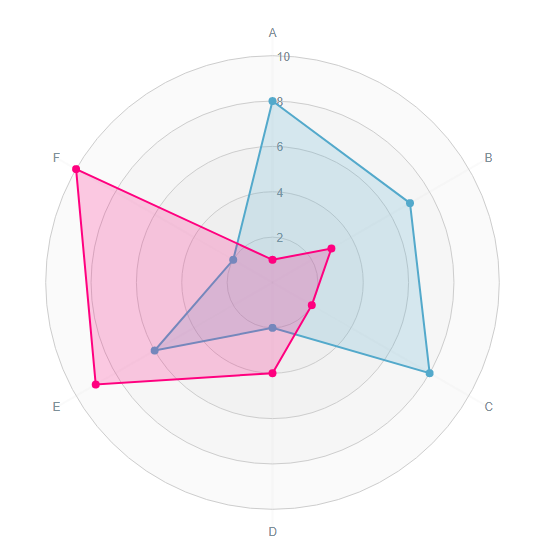
Want to quickly embed an interactive Sankey diagram to visualize flows? In urgent need for a flexible Radar Chart in your HR dashboards? Visualize a dynamic Network Graph to illustrate your department structure? We’ve got you covered.
Available as Viz Extensions soon!


Next-level data visualizations
15 Amazing visuals for your use case.
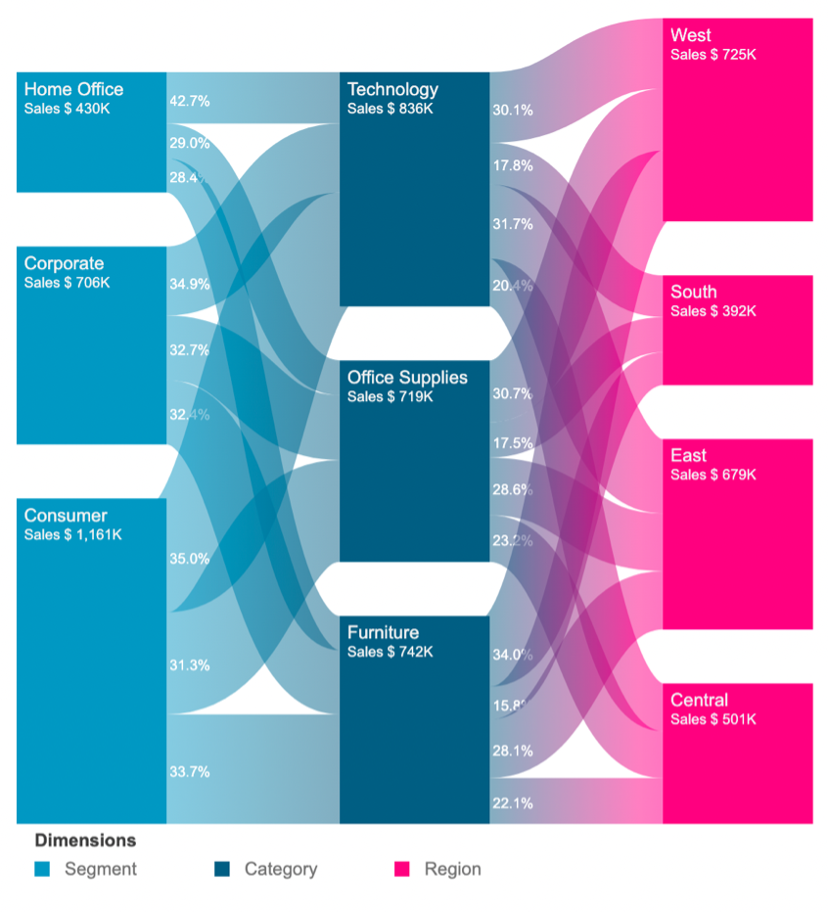


“I installed ShowMeMore in Tableau Desktop, imported the data I wanted to visualize and then I clicked a little bit around. Just like that, I created a Sankey Diagram! It only took about a minute, and the best part was that it effortlessly worked. It was really drag and drop on the dashboard and it works, which was the highlight of the experience.”
– Martin Seifert, CRM & Data Analytics
Learn from real-life use cases.


ShowMeMore in action with pre-built solutions.
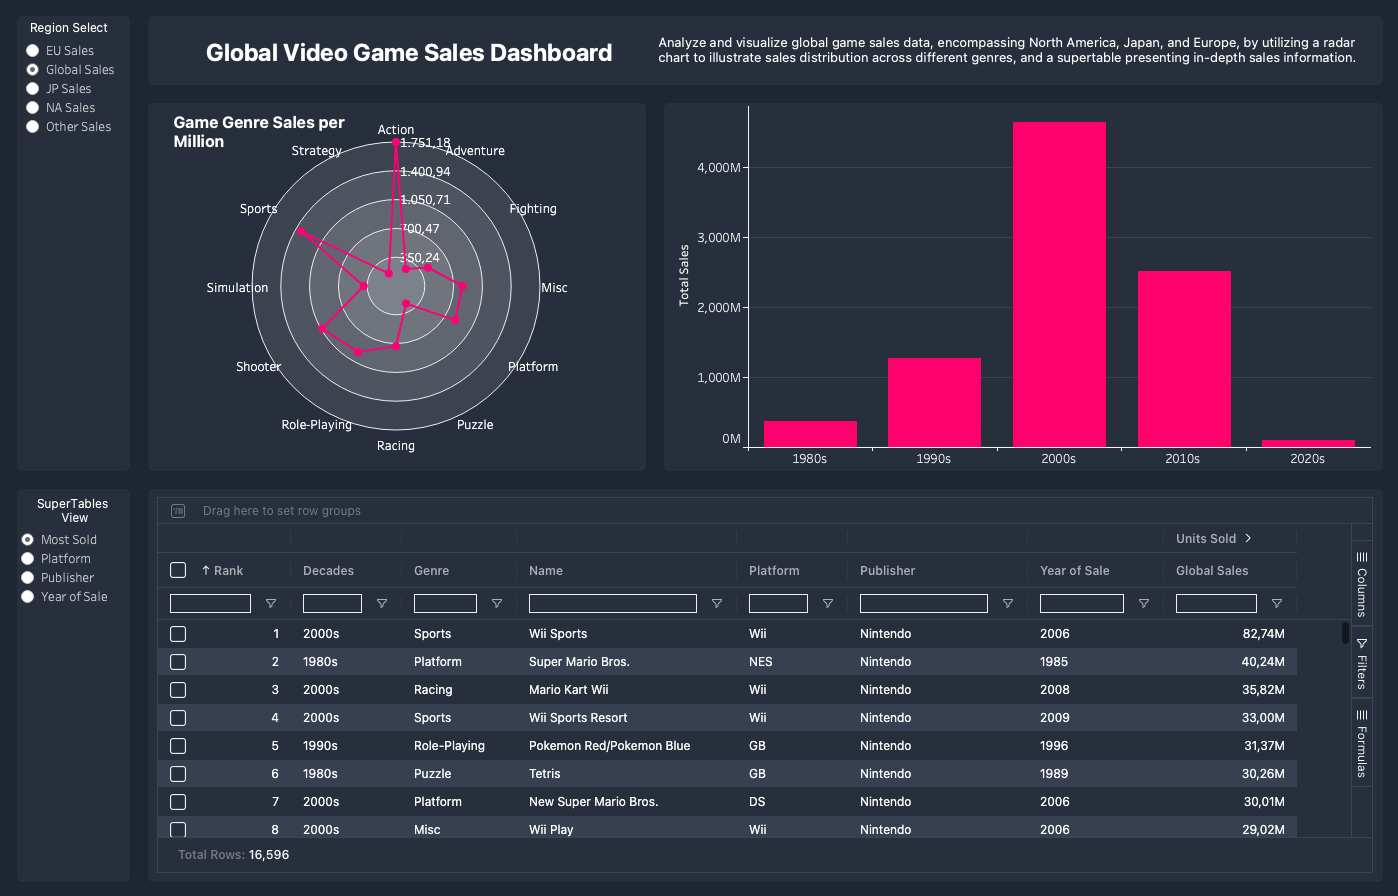
Unlock the world of global game sales with our ShowMeMore Tableau dashboard! Dive into North America, Japan, and Europe's gaming trends using a radar chart and supertable for a quick, insightful adventure. Elevate your understanding of sales distribution and genre dynamics.
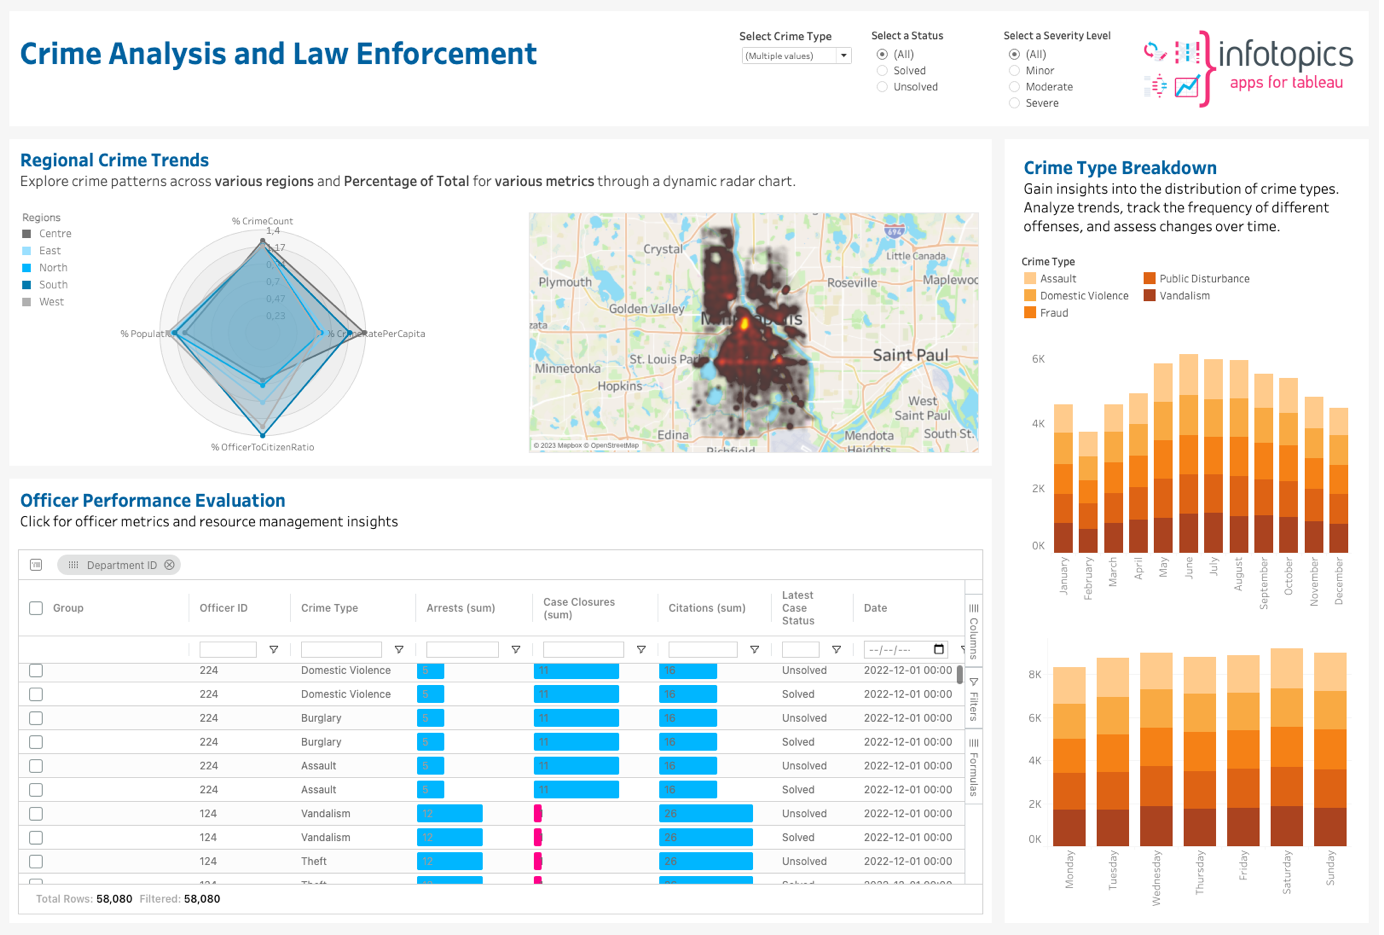
Empower your law enforcement agency with this Crime Analysis Dashboard, a robust solution designed to revolutionise crime management, optimize resource allocation, and enhance community safety. Delve into intricate crime patterns across regions using dynamic radar chart and interactive maps for proactive policing. The Stacked Bar Charts unveil crime type distribution, aiding in trend analysis for informed decision-making. With SuperTables Tableau extension, evaluate officer performance with granular detail, allowing tailored column order, grouping, and customised bar charts for optimised resource allocation. Interactive features promote community engagement, enhance resource deployment efficiency, reduce response times, and foster transparency, trust, and collaboration for safer neighborhoods.
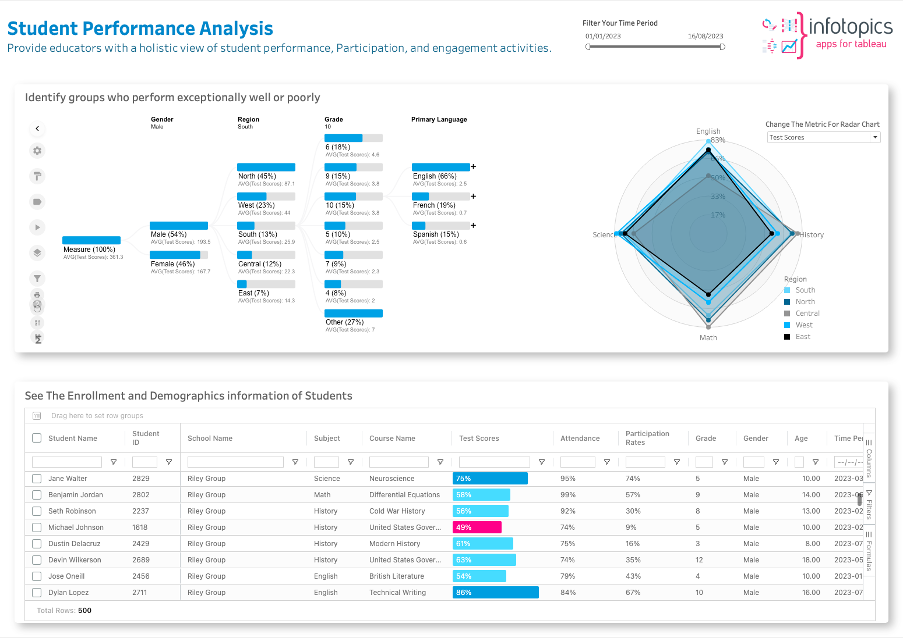
Maximize your educational institution's potential with our solution. Student Performance Analysis dashboards, empower you to explore student performance across key dimensions. Quickly identify trends and areas for improvement with condensed metrics, allowing tailored support for all students. The School Performance Evaluation dashboard complements this by providing a competitive edge in a data-driven educational landscape, streamlining insights for resource allocation and continuous improvement.
“Thanks to ShowMeMore, the team is now able to understandably visualize all flows and present them easily to the stakeholders.”
– Samuel Harper, Head Global T Business Systems at WWF

Let us help you get started.
Revolutionize your data with trusted partners.
The Apps for Tableau partner network is a trusted and experienced team of consulting and reseller partners, dedicated to serving professionals worldwide in their native language.
Discover how ShowMeMore can revolutionize the way you handle data, enabling you to make better-informed decisions and achieve remarkable outcomes in your industry. Locate one of our trustworthy partners and start optimizing your data-driven journey.
FAQ
Yes, you can request more information on the pricing page.
Yes, you can request more information by filling in the form on the pricing page.