Trusted.
By 600+ companies in 150+ countries.
Learn from real-life use cases.
Use Excel-like features without leaving Tableau.
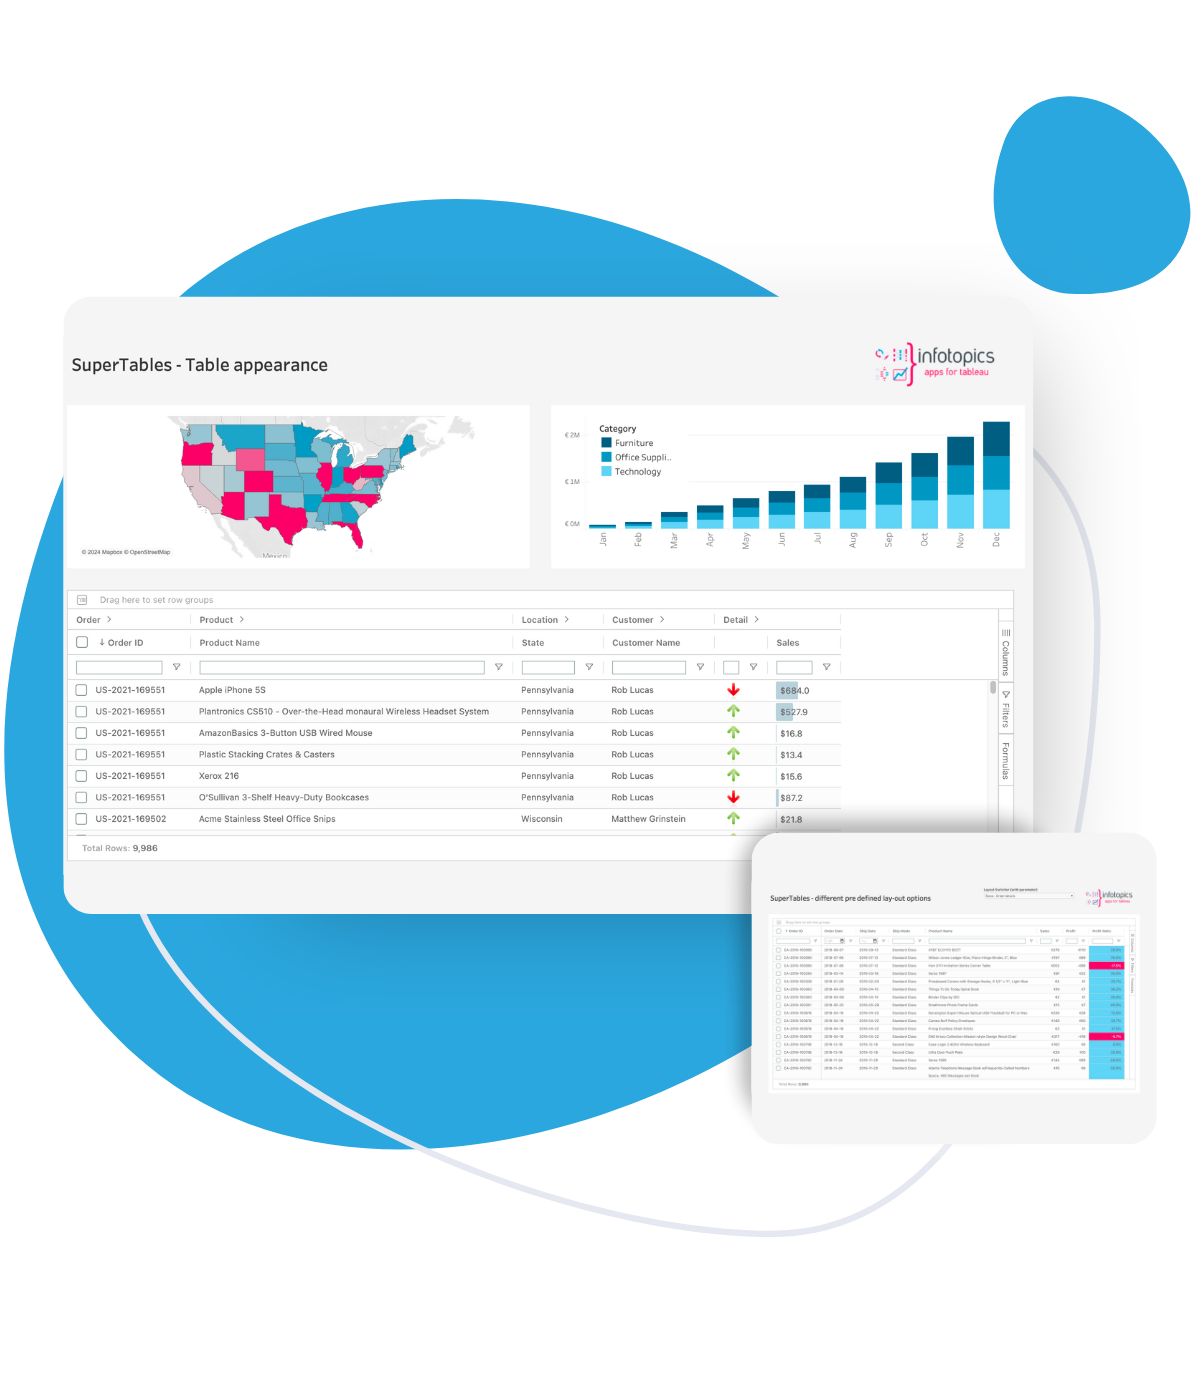
With the SuperTables Extension for Tableau and Power BI, you can offer your dashboard users the power of interactive and dynamic Excel-like tables. Enable users to decide how to organize and analyze their data in a flexible grid using features just like in Excel without leaving Tableau. Enrich your dashboards with SuperTables and allow your users to do their own analysis with the summarized data of your visualizations.
Countless features for your use case.

“I have over a thousand users on Tableau, and we are still growing at a rapid pace. SuperTables has made Tableau so much more accessible to people that are used to Excel and have raised their game for how they think about data and analytics at our company. Because it’s so easy to use, even savvy business users are able to incorporate it in a matter of minutes.”

“Now, users don’t have to go back to either the BI or my team and ask us to build specific tables for their needs. They have the flexibility to do it themselves with SuperTables.”

Download the FREE whitepaper.
Learn how to supercharge your Tableau Dashboards with SuperTables.
Better Together.

FAQ
Yes! Apps for Tableau has officially achieved ISO/IEC 27001:2022 certification.
You can find the information about our data security here.
Yes, you can request more information on the pricing page.
Yes, you can request more information by filling in the form on the pricing page.


