ShowMeMore
Next-level data visualizations
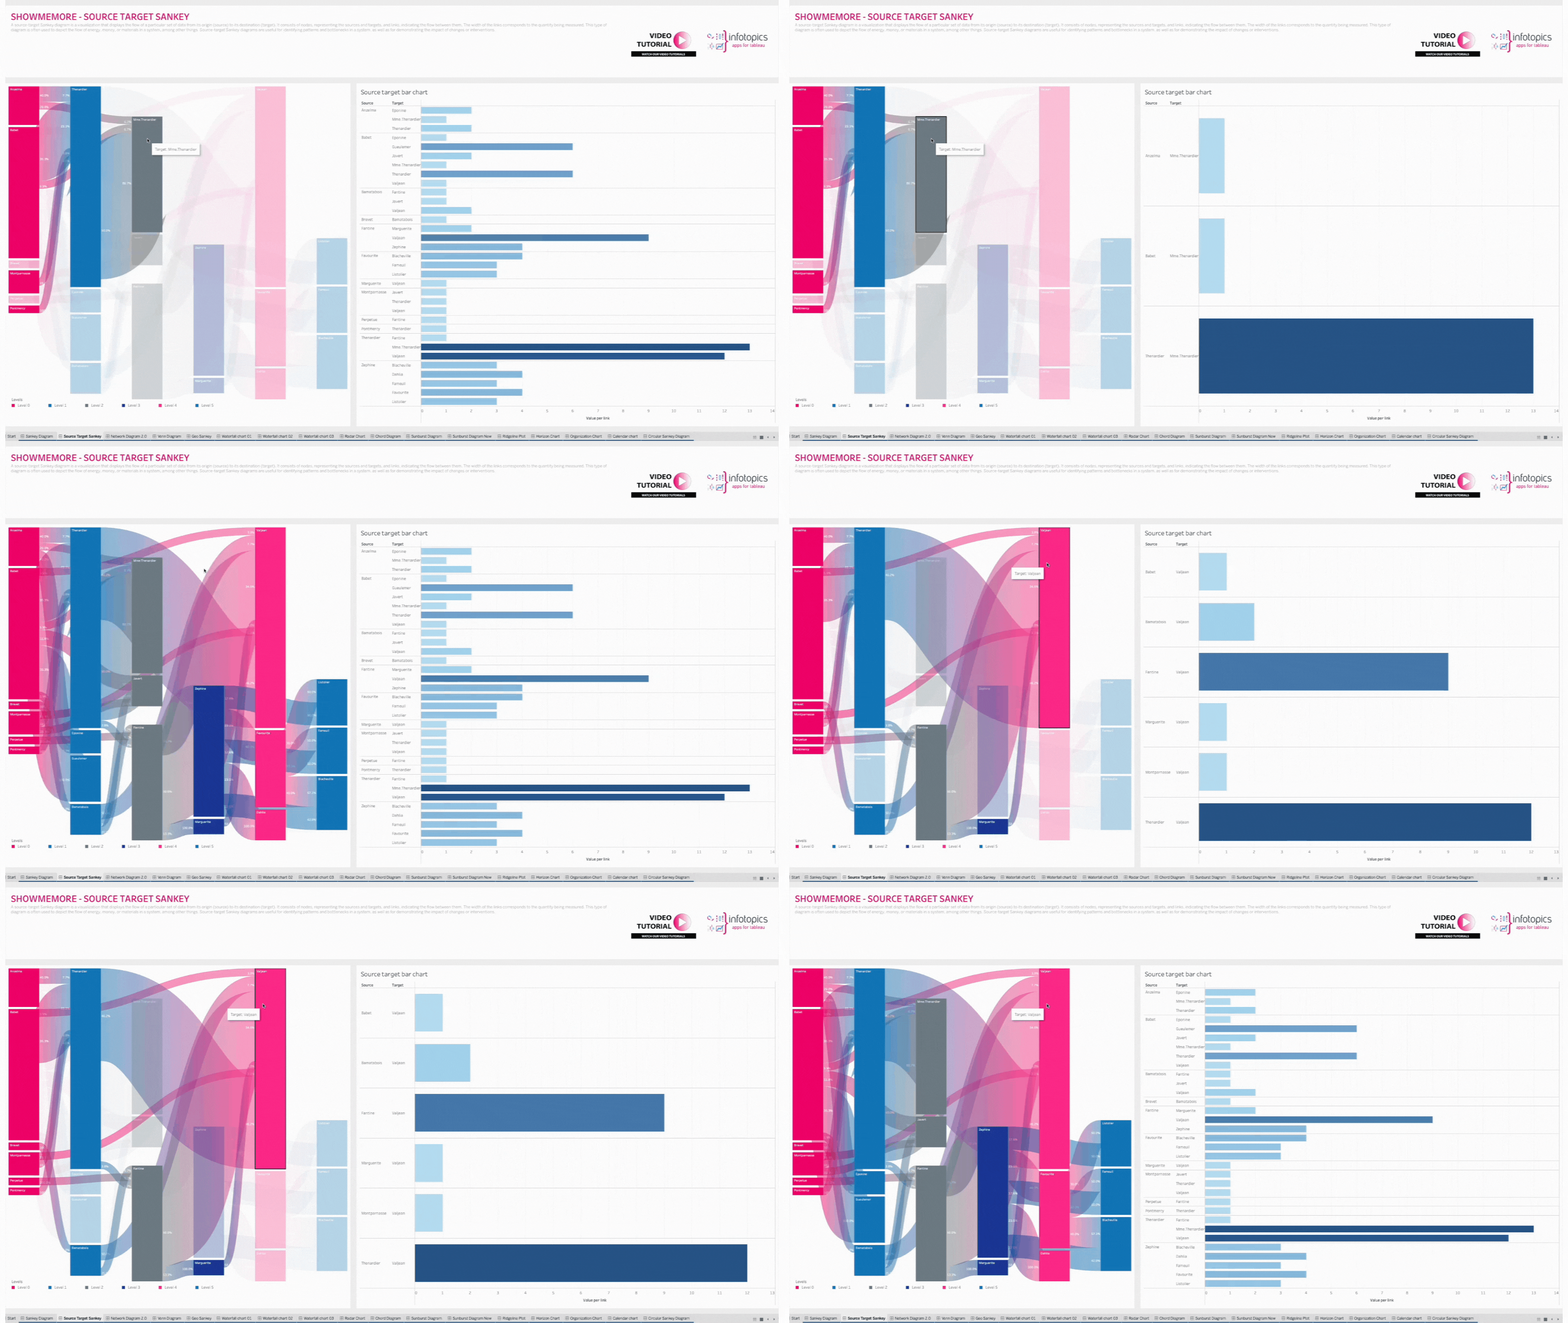
15 Amazing visuals for your use case.

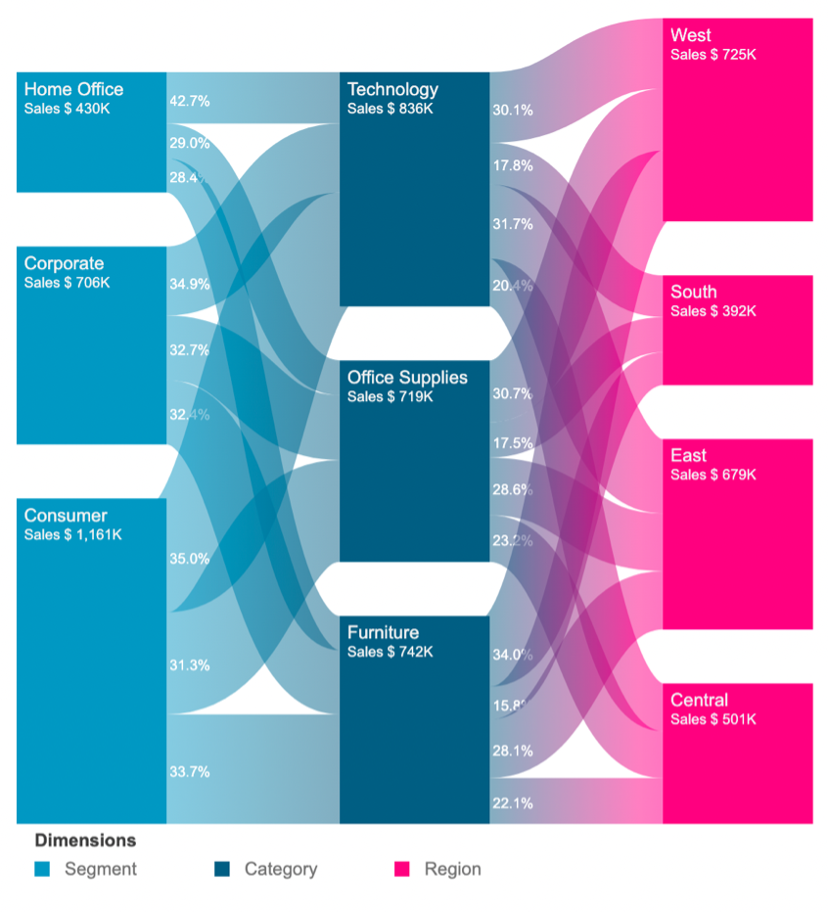
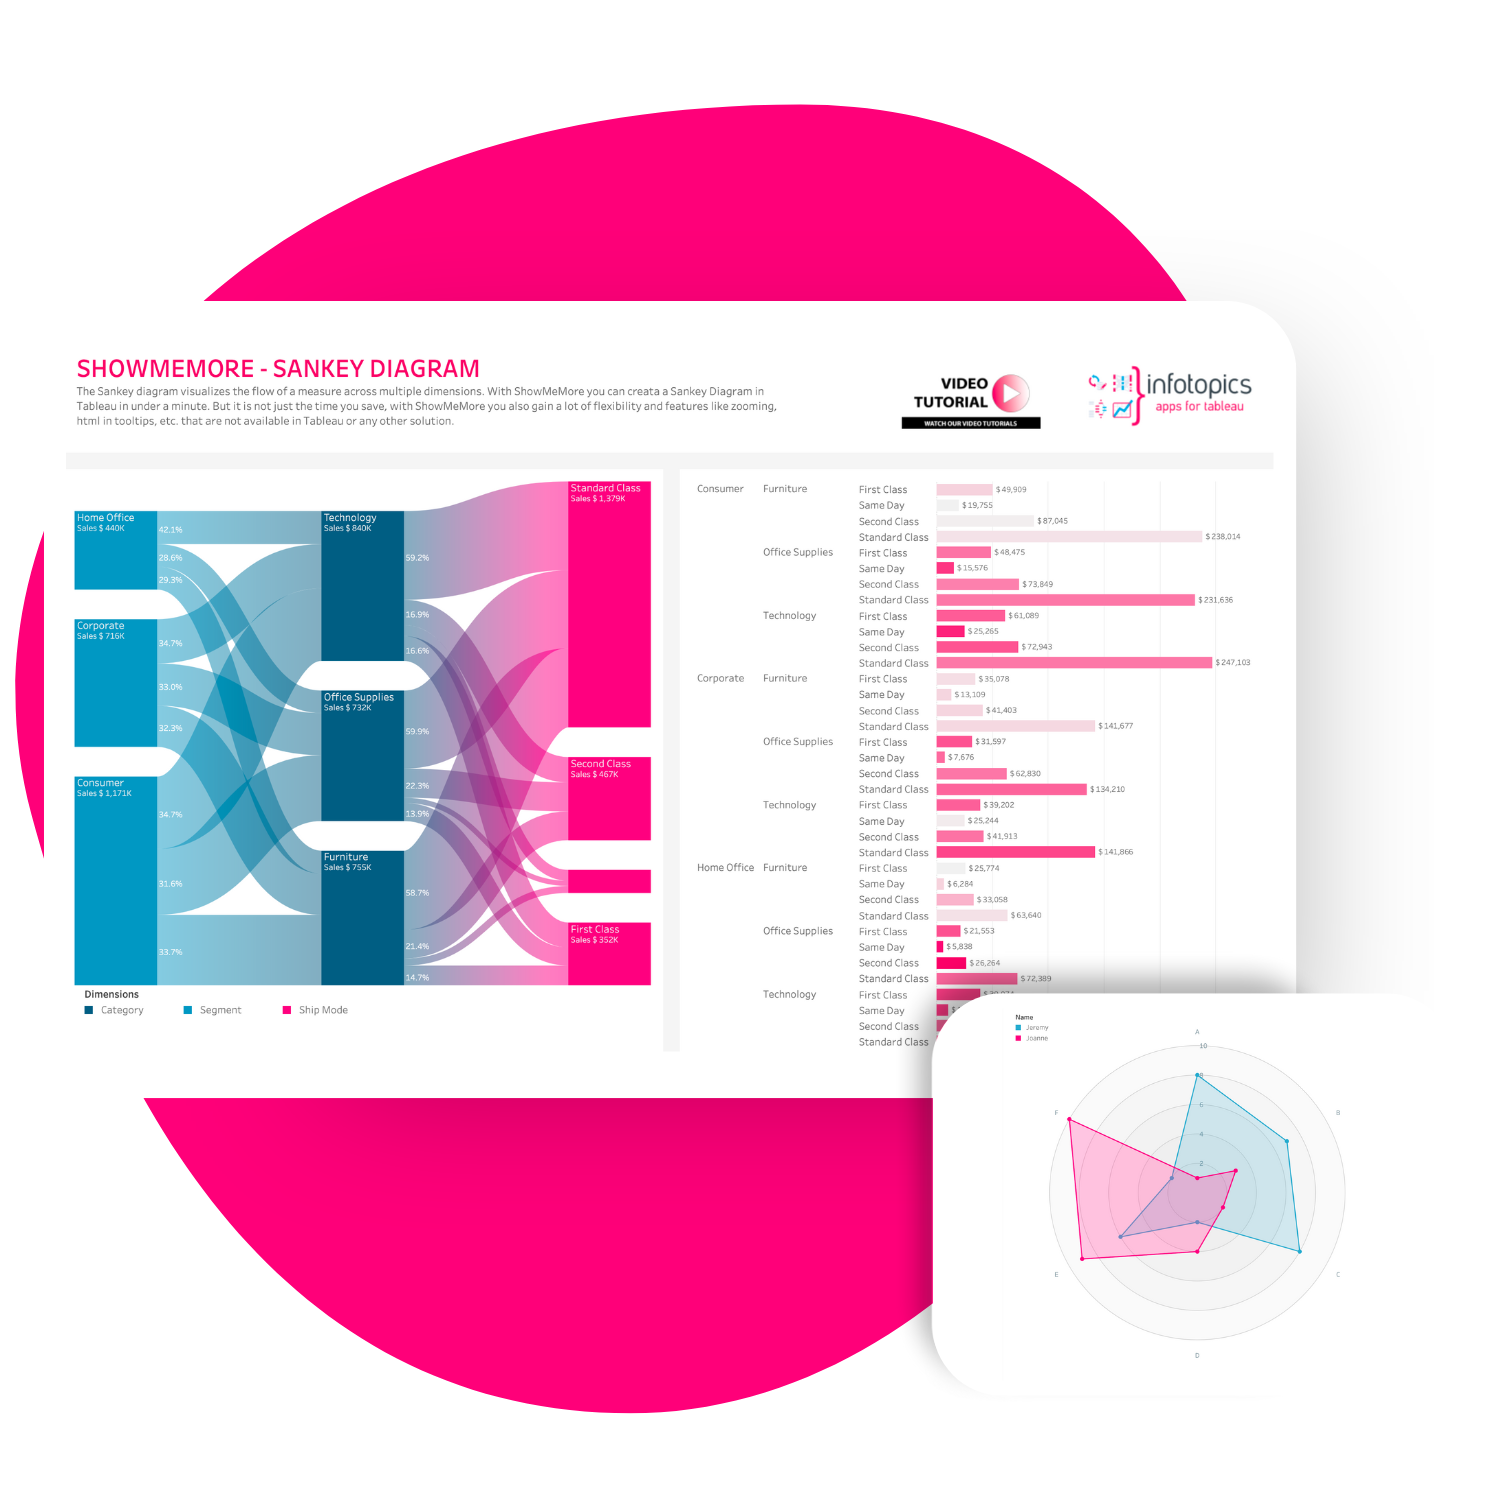
“I installed ShowMeMore in Tableau Desktop, imported the data I wanted to visualize and then I clicked a little bit around. Just like that, I created a Sankey Diagram! It only took about a minute, and the best part was that it effortlessly worked. It was really drag and drop on the dashboard and it works, which was the highlight of the experience.”
– Martin Seifert, CRM & Data Analytics
Learn from real-life use cases.
ShowMeMore in action with pre-built solutions.
This solution, powered by the PowerKPIs and Sankey Viz extensions, provides a clear snapshot of educational funding and performance for institutions in 2024. It visually breaks down funding sources, tracks financial metrics like cost and revenue growth, and highlights grant distribution and student demographics. It's an essential solution for stakeholders to monitor financial health and make data-driven decisions easily.
Explore our dynamic dashboard showcasing global electricity production, clean fuel accessibility, and energy consumption, with a focus on the Netherlands. Using innovative charts like horizon and Sankey, we offer a clear view of the world's energy landscape. Dive into shifting power generation sources, track clean fuel access, and monitor CO2 emissions from coal. download this dahsboard for understanding the complexities of our energy future.
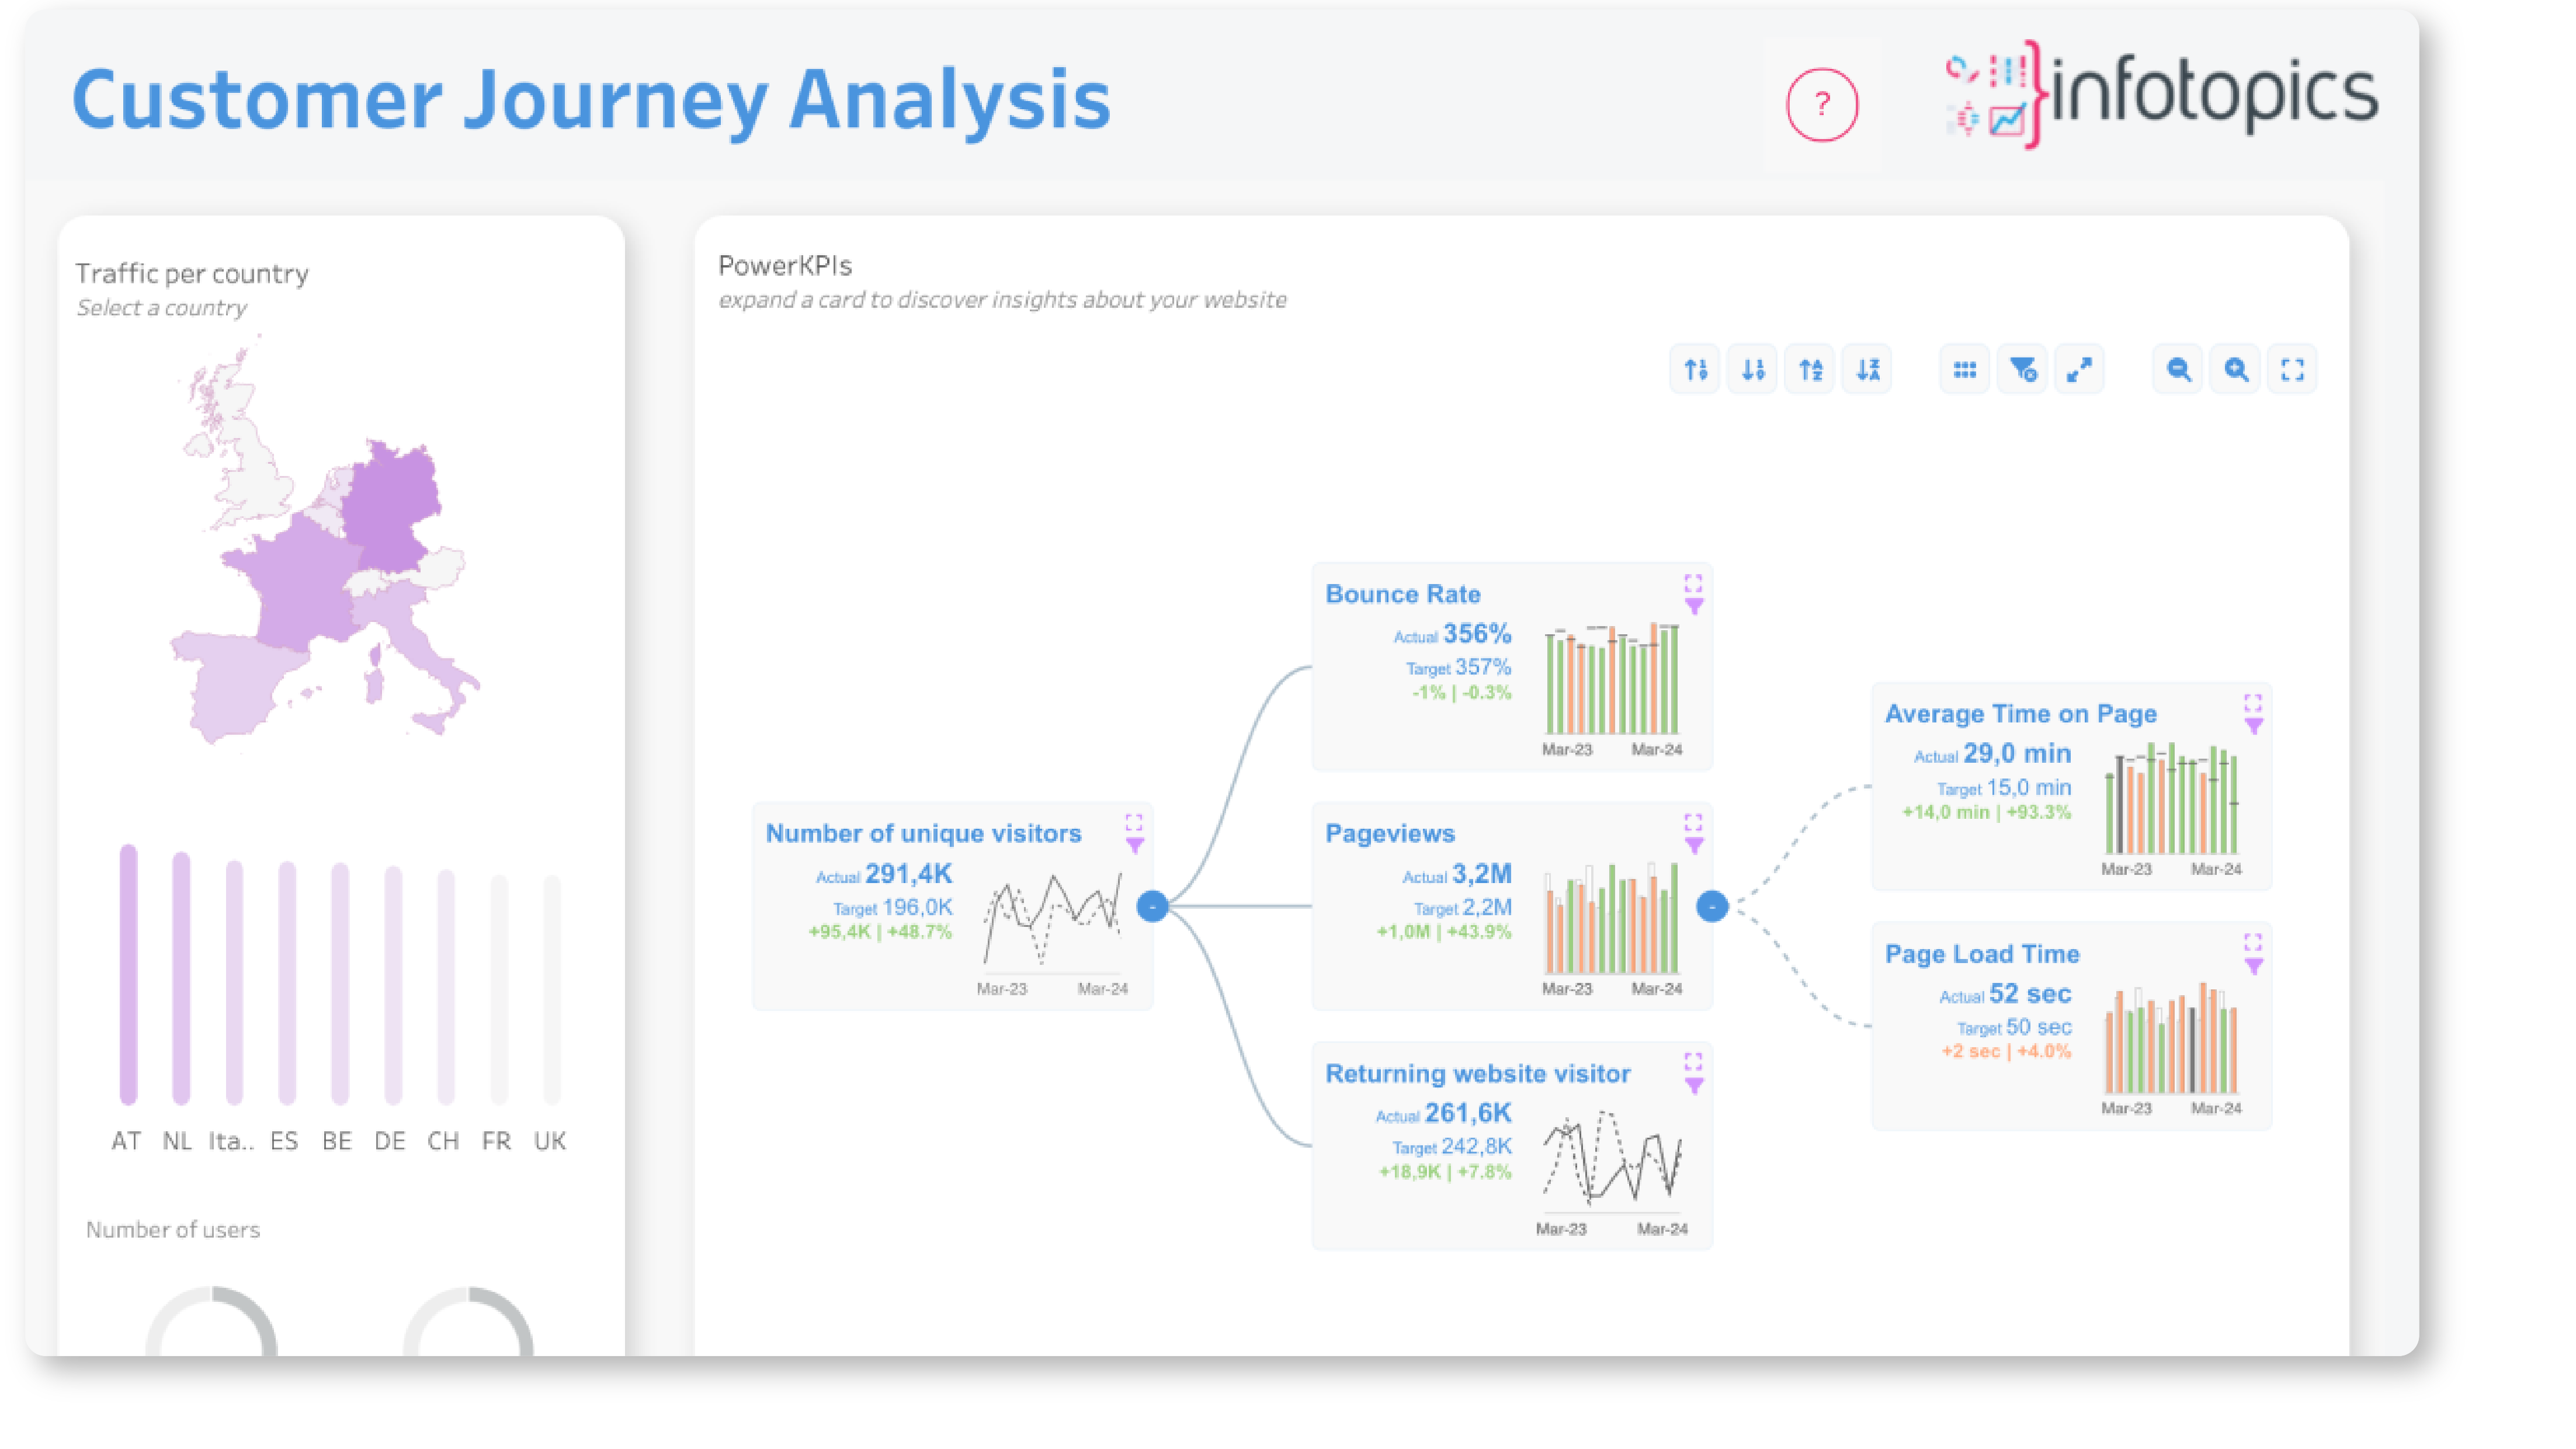
We understand the numerous responsibilities you manage, from optimising your website to monitoring performance metrics. That's why we've developed PowerKPIs—to streamline your decision-making process and make your job easier.
“Thanks to ShowMeMore, the team is now able to understandably visualize all flows and present them easily to the stakeholders.”
– Samuel Harper, Head Global T Business Systems at WWF

Let us help you get started.
Revolutionize your data with trusted partners.
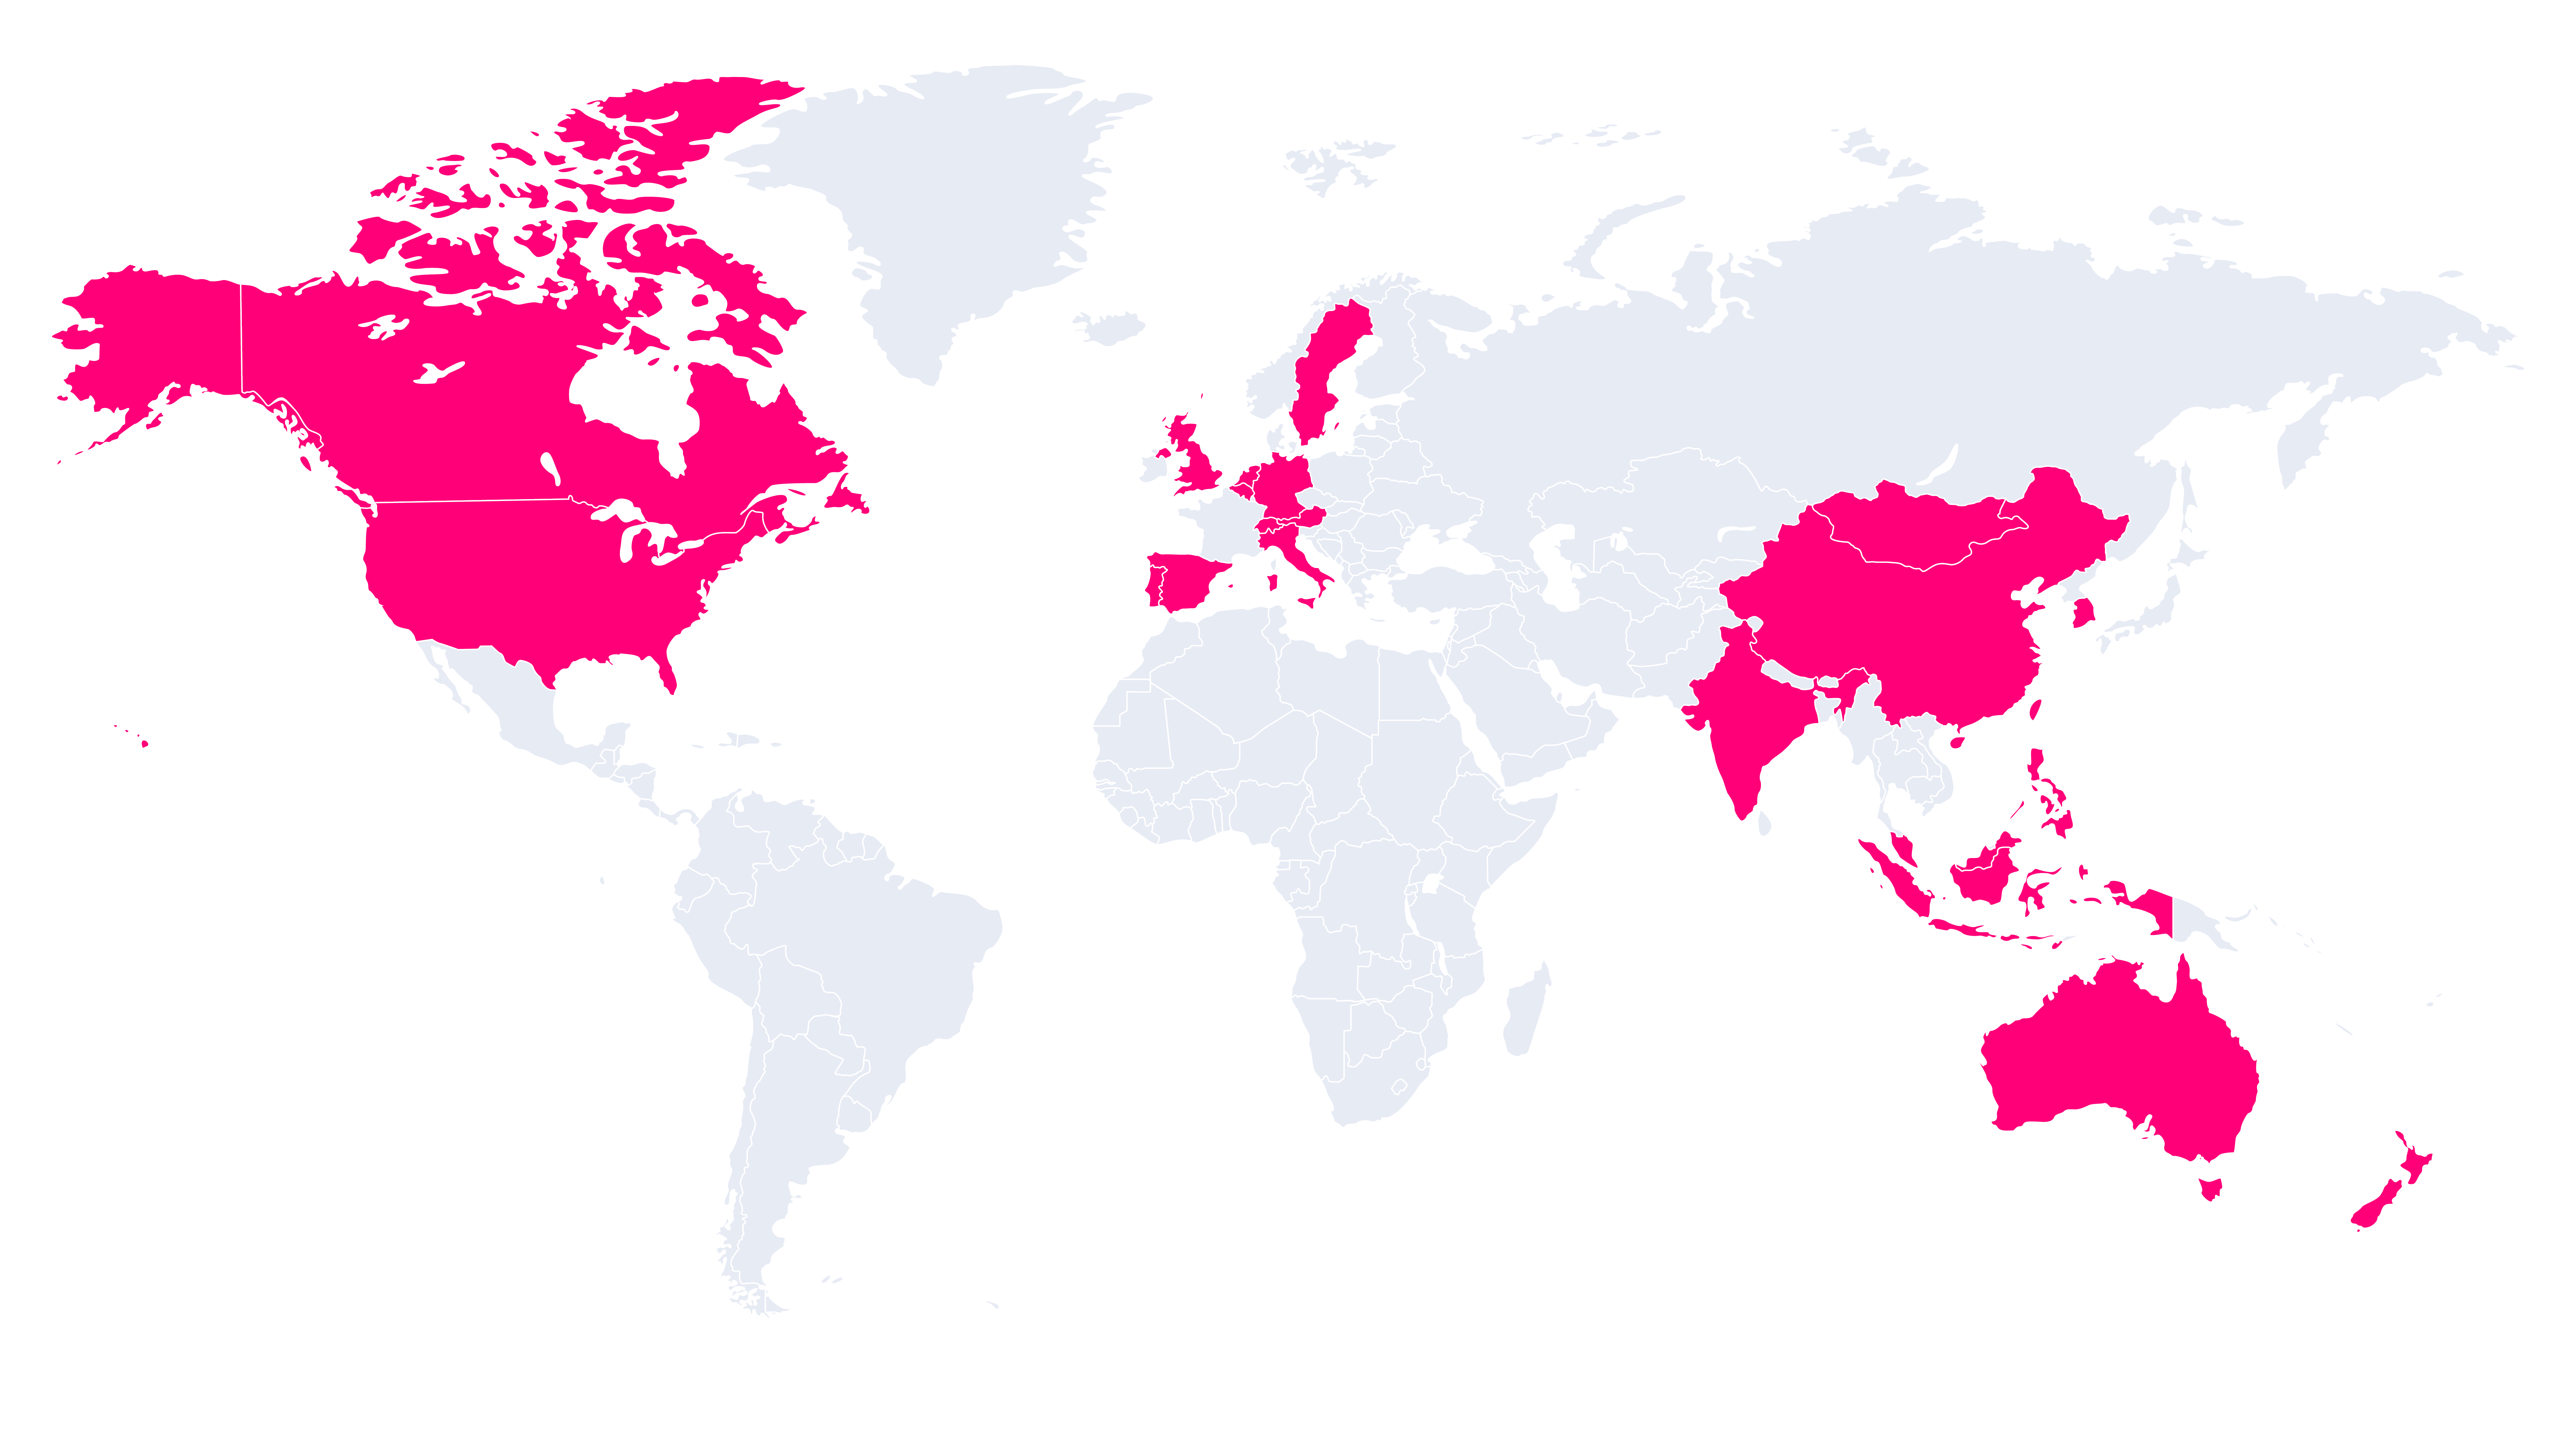
The Apps for Tableau partner network is a trusted and experienced team of consulting and reseller partners, dedicated to serving professionals worldwide in their native language.
Discover how ShowMeMore can revolutionize the way you handle data, enabling you to make better-informed decisions and achieve remarkable outcomes in your industry. Locate one of our trustworthy partners and start optimizing your data-driven journey.

FAQ
Yes! Apps for Tableau has officially achieved ISO/IEC 27001:2022 certification.
You can find the information about our data security here.
Yes, you can request more information on the pricing page.
Yes, you can request more information by filling in the form on the pricing page.


