9 Creative Ways to Use Tableau Extensions for Game-Changing Analytics
Welcome to our blog series about Tableau Extension use cases and how to best utilize them in your business! If you’re looking for information on Tableau Extensions, you’ve come to the right place. Here, you’ll find all the latest news, tips, and tricks on everything related to Tableau Extensions. Whether you’re a beginner or an expert, you’ll surely find something new and valuable here.
1. Use Tableau Extensions to create stunning data visualizations.
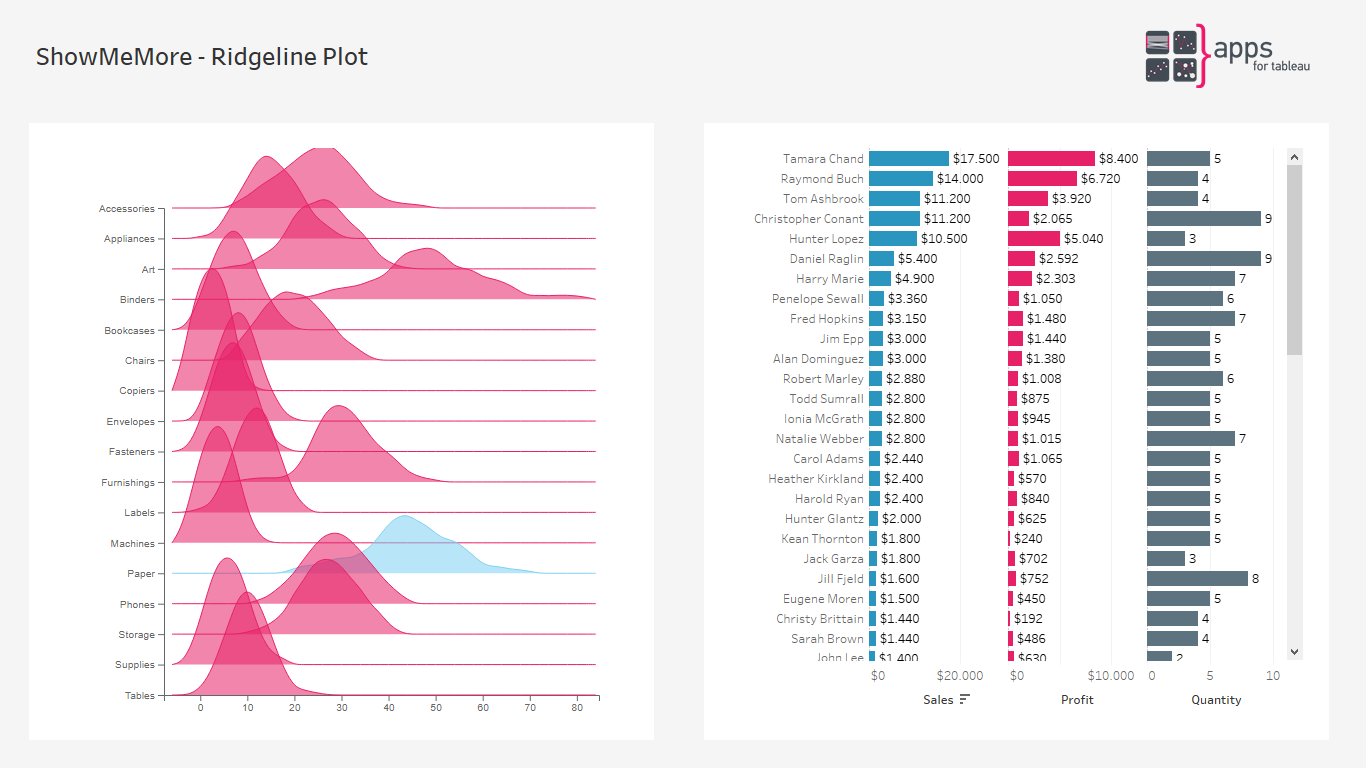
Tableau is a powerful data visualization tool, but there are some types of charts that are impossible to create in Tableau. And for some charts, you need a tremendous amount of time and knowledge. ShowMeMore will help you to embed amazing visualizations in your dashboards and provide insights in your data like never before!


ShowMeMore is an amazing solution that provides a wide list of stunning visualizations that are impossible or very hard to create in native Tableau. You can create a truly unique and engaging visualization and interact with your data in a variety of ways, making it much easier to explore and understand your data.
2. Use Tableau Extensions to create custom reports and dashboards.
Tableau allows you to slice and dice your data in an easy way. Although the platform offers perfect functionalities, sometimes you need that extra option to make your dashboards stand out from the crowd. In retail for example, reports are often about products.
PictureThis is the ultimate Tableau Extension that enables you to integrate your (product) images into your daily reporting. Instead of displaying EAN codes SKU’s you easily enrich your dashboard with product images based on URLs in your dataset. It is very easy to replace product codes, EAN’s, or any combination of numbers with an image recognizable to everyone.
Imagine managing and reporting your analytics would be as user-friendly as browsing your website! With PictureThis, it is possible!

PictureThis is a valuable solution for anyone who wants to better understand their data and be able to find actionable insights in a visual way by using (product) images. If you have complex data, we recommend you check it out and download your free trial.
3. Use Tableau Extensions to implement ProcessMining techniques.
You can benefit from ProcessMining techniques to improve the collaboration or efficiency of your workflows in many ways. For example, you can:
- Identify areas where process improvements can be made
- Optimize resource utilization.
- Identify possible fraud
- Streamline communication and coordination between team members
- Track and improve individual or team performance.
- Monitor compliance with company policies or procedures
- Identify training or development needs.


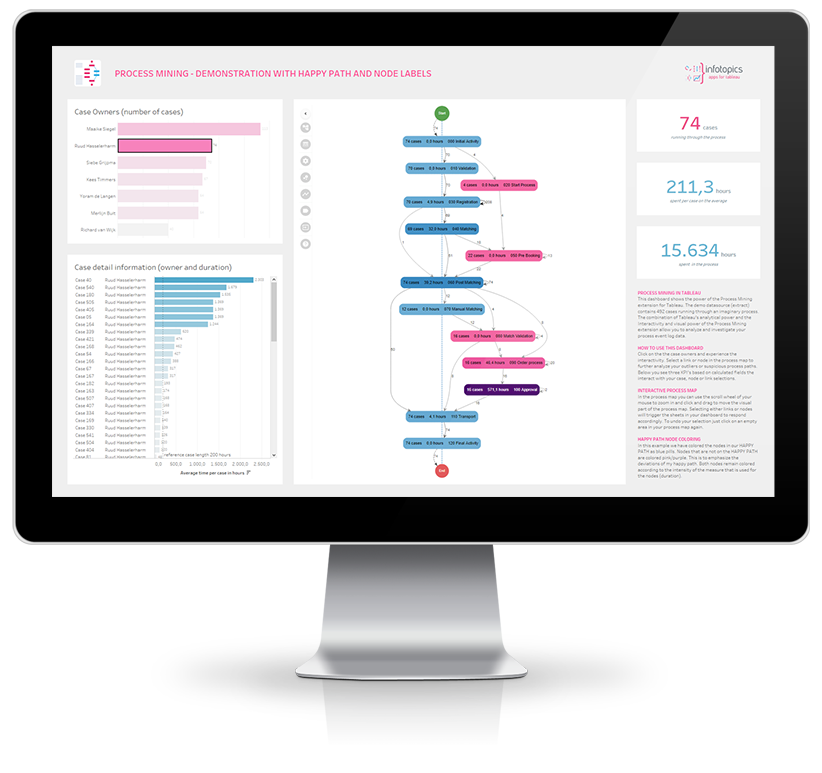
ProcessMining is an Extension that enables you to analyze data directly from your process event logs in order to see how a process is actually carried out. It prevents you from making assumptions about how the process should go. In short, ProcessMining can be an amazing tool for empowering any organization or team to improve their performance and you can make your business run like a well-oiled machine!
4. Use Tableau Extensions to create interactive and informative data visualizations.
Everyone admits that Excel has a huge benefit in handling data sheets. It is a powerful spreadsheet application that can be used to perform complex calculations and data analysis.
A big disadvantage of using tools like Excel in your organization is that you loose governance and security once your data is exported to Excel. Besides, dealing with multiple platforms and reports requires more time and effort to maintain separate versions for each one. This can quickly become a daunting and expensive task, particularly if there are frequent updates or changes required. In addition, it can be difficult to keep track of which version is which and to ensure that all versions are up-to-date. This can lead to confusion and inconsistency, and may ultimately result in lower profits.
The Great news is that now you can have an interactive table with Excel like functionalities inside your Tableau Dashboards, while respecting the governance and security of your Tableau platform with SuperTables.

Turn your data sheets into plain English!
Dashboard designers can even decide to allow formatted Excel exports for a controlled set of data if the privacy sensitivity of the data allows exporting, and that saves your time and effort from creating additional reports in Excel.
If you’re looking for ways to take your Tableau analytics to the next level, you should definitely check out SuperTables. Instead of creating different views from the same dashboard, you can now offer flexible tables inside your Tableau dashboards to have your users create their own personal favorites. This win-win situation saves time in developing a dashboard, increases end-user flexibility, and respects corporate governance and security.
SuperTables is the go-to solution if flexibility is needed and governance and security are required!
5. Use Tableau Extensions to help you make better decisions with your data.
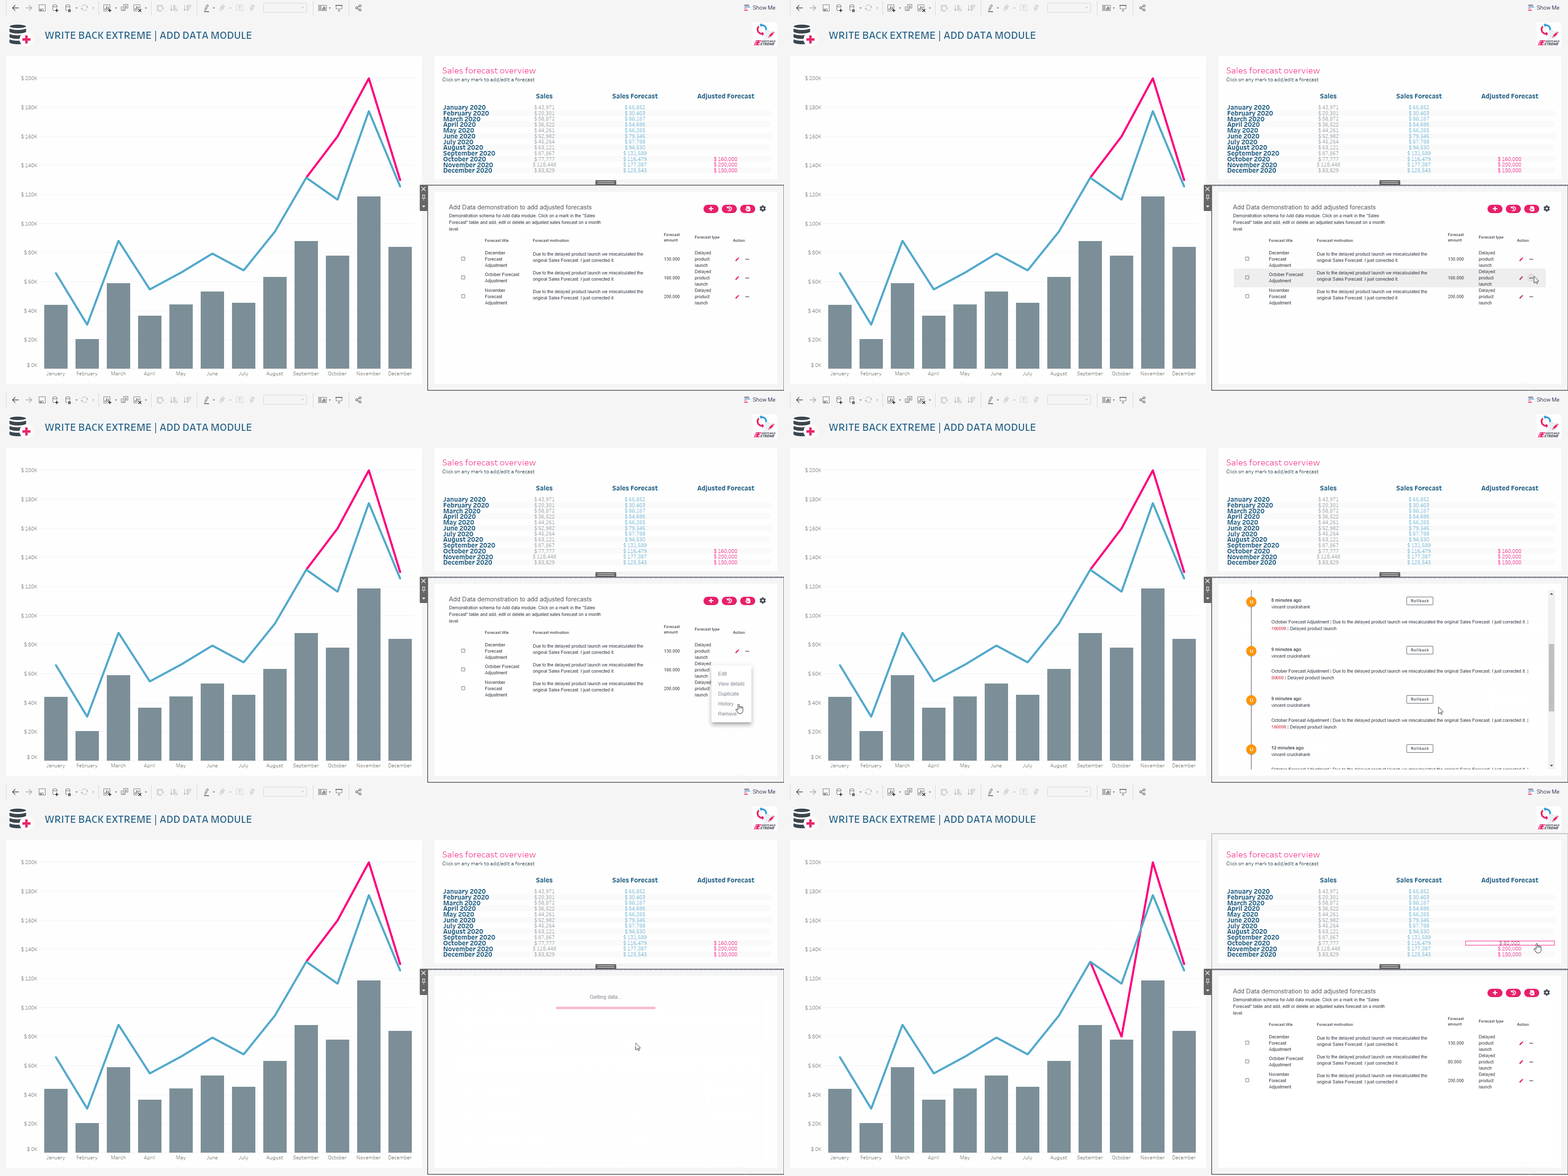
Most analytics tools are based on strictly read-only technology. When you have your analytics ready, it’s sometimes impossible to change your data or update it to see the different outcomes without adding data directly to your database or using a third-party application. In many cases, you might want to have the ability to enrich, add, delete or edit existing data behind a Tableau visualization and instantly see how those changes are reflected in the Viz. The Ultimate What-If scenario can now be played inside your Tableau dashboards.
With Tableau Extensions you know what is actually working and there is no more guessing!

WriteBackExtreme solution examples:
- Track customer behavior
- Play What-IF scenarios
- Commit price changes in retail
- Optimize marketing campaigns
- Improve customer service
- Monitor and edit inventory levels
- Track employee productivity
- Improve financial forecasting

It is a flexible tool that can be used in a variety of ways to improve the quality and usefulness of data, and there are many more potential use cases for WriteBackExtreme that you can try for free and explore for yourself.
By using WriteBackExtreme, you can make your data work for you and improve your decision-making process.

In short, WriteBackExtreme gives you the power to:
• Track changes to data over time and makes decisions accordingly.
• Identify errors or discrepancies and fill in missing data.
• Create custom reports or export data for further analysis.
• Track the progress of your decisions and see how they impact your business.
Tableau Extensions are a great way to improve your decision-making with data. With write-back capabilities, you can easily keep your data up-to-date and ensure that you make the best decisions possible.
6. Use Tableau Extensions to find patterns and insights easily.
There are many times when you need to explore your data from different perspectives and layers of detail. Your dashboards have superb visualizations and overviews of the current situation. But what if you want to do a root-cause analysis without a pre-described path for analyzing and quickly spot outliers?
Think about situations like these:
- What can be the reason behind a mark being identified as an outlier?
- How can I identify possible areas of improvement to my processes and systems.
- When something goes wrong, you need to determine what caused the situation to prevent it from happening again.
- When you need to identify and correct systemic issues that lead to errors or adverse events.
- When you need to identify and correct production problems or problems with curriculum or instruction.
And these are only some of the potential use cases for drilling down into your data.
In situations like these, where the problem is complex or a quick fix is not possible, Root Cause Analysis (RCA) can be a helpful method to solve it.
You can use RCA to identify all the possible causes of a problem, then test each one to see if it is the real source of the problem and optimize your process and resources or prevent future incidents from occurring.
Performing a root-cause analysis enables you to find a viable solution for a problem, rather than simply treating the symptoms, and can help you streamline your operations and boost your bottom line.

DrillDownTree is a fantastic solution that enables you to perform RCA and find the needle in the haystack of your data. Your dashboard users can drill down the data in any order they want without the hassle of doing a lot of data prepping (like creating hierarchies, for instance).
You can see the big picture, drill down into the details, and see data from various perspectives. This is helpful because it allows you to see trends and patterns that you might not be able to see if you were looking at the data in a sheet.
Use DrillDownTree to find patterns quickly and easily in your data. With just a few clicks, you can discover hidden insights and relationships in your data that you never knew existed.
7. Use Tableau Extensions to share your data visualizations effortlessly
Imagine you have created your visualizations and now thinking about communicating them with your team.
You are going to email your workbook? How about sharing your dashboard and findings, right away in Microsoft Teams?
The Coolest Way to Share Your Visualizations is only one click away
DreamTeams allows you to share your visualizations from Tableau to Microsoft Teams in a channel or private message. You can also send a link to your Tableau dashboard. The link contains all the filters and parameters applied by you, so your receivers will see exactly what you see. Simple.

DreamTeams make it possible to share your dashboard and have your team’s feedback or input on the topic instantly.
8. Use Tableau Extensions to make your findings count with a compelling story.
If you want to engage your audience truly, don’t simply show them your analytics. Tell them a story with it. Data is meaningless without context, so use your analytics to paint a picture of what’s happening. What trends are you seeing? What do your numbers mean in the real world? Do you see results from your latest marketing campaign?


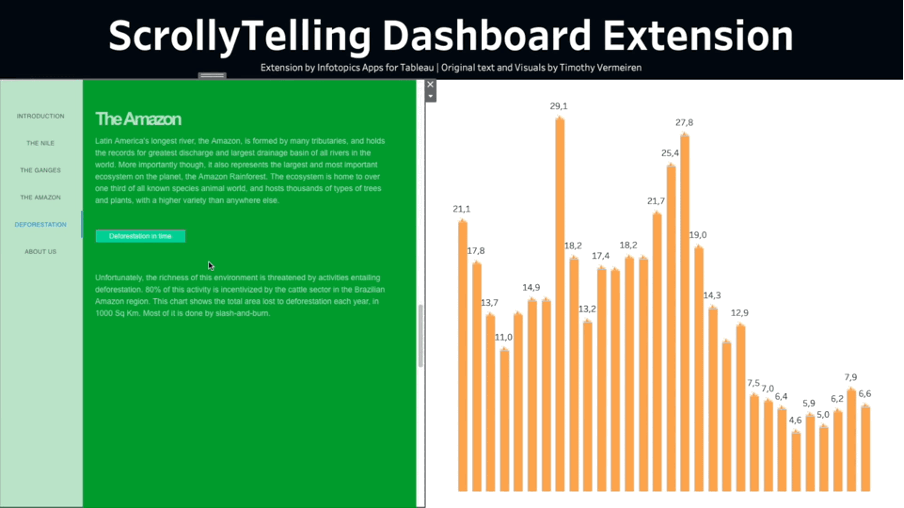
ScrollyTelling helps you to create a gorgeous story from your dashboard, and you are able to scroll down and explain your thoughts.
Your audience will appreciate your effort in making your analytics understandable and relevant to their lives. In return, they’ll be more likely to listen to what you have to say and take action on your recommendations.
9. Use Tableau Extensions to quickly and easily publish your data visualizations.
Insightful and accurate analytics are only halfway to success; Turning the insight into actions and decisions is the final step for making an impact.
Creating reports out of analytics can be an unpleasant, time-consuming task and causes a lot of trouble if a mistake happens; the proper report, on the other hand, is the only way to bring everyone in the team on the same page.
With VizSlides, reporting was never easier, and now you can make your Viz work for everyone.
VizSlides allows you to have an interactive dashboard in your PowerPoint presentations. Instead of multiple slides to prove one point, you can show it to them in one interactive slide and benefit from both worlds!


We love to make solutions and help Tableau users to do things more efficiently. If you have feedback, ideas, questions or need support, please share them with us! Also, don’t forget to follow us on social media for our latest news and updates.